Announcements and News:
Site Navigation: ![]()


Page address:
File created:
Jan 7, 2001
Last modified:
Jan 8, 2003
Definitions:
Double-click on any word
Announcements and News: |
Problem/Purpose:
So far in the Atmosphere Section of the course you learned how Earth's atmosphere developed and changed, how the natural components and pollutants cycle in and out of the air, how the atmosphere's movements are powered by heat and produce vertical and horizontal movements, how those movements produce clouds, storms, clear skies and wind, and how we measure and observe the atmosphere. Your focus was on acquiring the knowledge you need to manage the atmosphere.
Your management of the atmosphere takes place at many levels. As a long term goal, management of the atmosphere includes inventorying how it works and how we affect it, planning what you and your society and government should do to maintain it, then following and modifying your plan for the rest of your life. On a short time scale, management of the atmosphere means inventorying what the weather will do over the next few days then planning for it and using that plan to benefit yourself.
Your task is to predict the weather.
Research:
|
1. There are many sources of weather information available to you, including the graphics used in class. Visit some web sites and see what they
display about our current weather and what they predict for the next few days.
Notes:
|

|

|
|
|
2. Look outside, then check the most recent
display from our
weather station to see what is happening now. You may also want to look at the graphs of the
most recent data from the weather station.
|

|
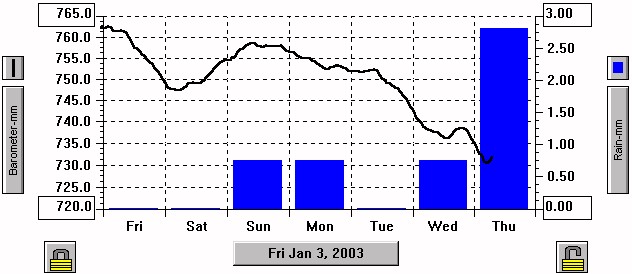
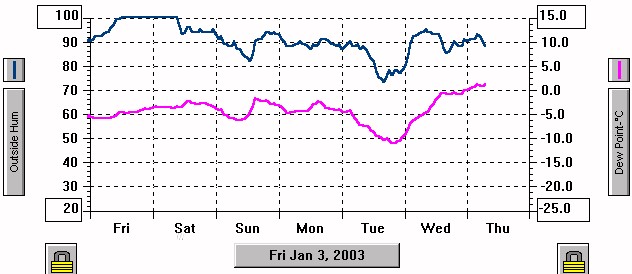
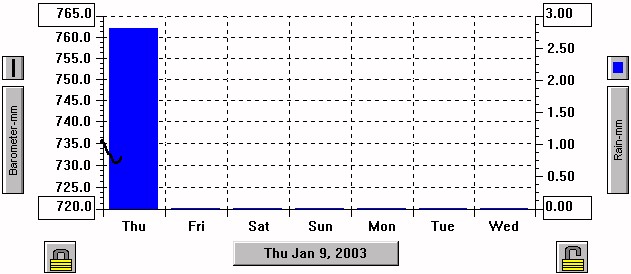
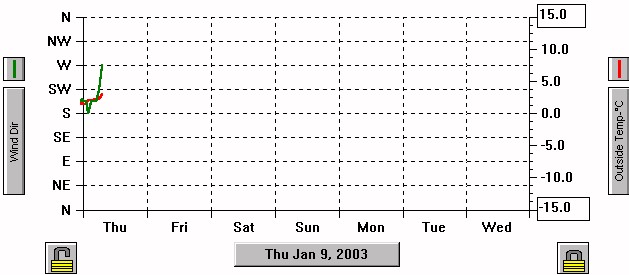
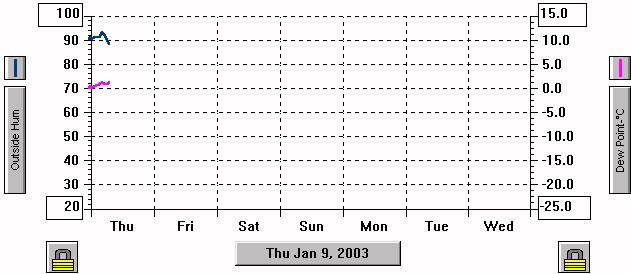
1. On a separate page of your handout are three graphs showing recent trends in weather data. Use what you have found out in your research to predict what will happen for the rest of the week with this data. Draw the lines on the paper copy to represent your prediction. Hand in the page of graphs at the end of class after you have recorded your predictions in the table below.
2. Fill in your prediction for the weather on the data table on the rows labeled "Predicted". Use the lines you drew on the graphs to fill in those numbers. Predict the other data too.
Test your predictions.
Instructions:
1. Fill in actual data for twice each day using your own observations or using data from the LSM weather station. A printout of this data will be available after vacation.
2. Subtract to find the difference between your predictions and the actual data.
3. Sum the total differences twice each day.
4. At the end of the week, rank how well you predicted the data. The type of data
you predicted the best gets a rank of 1, the least well predicted an 11.
6. Make a bar graph to show the quality of your predictions over time. This will show if your short term predictions were more or less accurate than your longer range predictions.
7. Write a conclusion about predicting weather.
Name: ____________________________ Per: ____ Date:
____________
(Click on a graph to display it full size)

Name: ____________________________ Per: ____ Date:
____________
(Click on a graph to display it full size)
Name: _______________________ Per: ____
| Date | Time | Temp ﺍC | Wind Chill | RH % | Dew ﺍC | Wind Speed kph | Gust kph | Wind Dir | Rain / Snow mm | Bar | Cloud Cover | Observations | Total Diff |
| 12/19 | 19:00 Predict | ||||||||||||
| Actual | |||||||||||||
| Diff | |||||||||||||
| 12/20 | 07:00 Predict | ||||||||||||
| Actual | |||||||||||||
| Diff | |||||||||||||
| 19:00 Predict | |||||||||||||
| Actual | |||||||||||||
| Diff | |||||||||||||
| 12/21 | 07:00 Predict | ||||||||||||
| Actual | |||||||||||||
| Diff | |||||||||||||
| 19:00 Predict | |||||||||||||
| Actual | |||||||||||||
| Diff | |||||||||||||
| 12/22 | 07:00 Predict | ||||||||||||
| Actual | |||||||||||||
| Diff | |||||||||||||
| 19:00 Predict | |||||||||||||
| Actual | |||||||||||||
| Diff | |||||||||||||
| 12/23 | 07:00 Predict | ||||||||||||
| Actual | |||||||||||||
| Diff | |||||||||||||
| 19:00 Predict | |||||||||||||
| Actual | |||||||||||||
| Diff | |||||||||||||
| Rank | 1 - 11 |
Page address: