GMT is a program useful for mapping. it has a set of 60 tools for manipulating geographic
and Cartesian data sets.It is able to produce encapsulated Postscript file (EPS).The kind of
figure that is capable of plot range from a simple x-y plots until illuminated surfaces and 3D
perspective views.
Ploting A simple map
A common way of usign GMT is by inputing the commands through a terminal window(using cygwin for example)
Let's see a simple example
Suppose that you want to do a map of your country the way you could do this is using the next commands
pscoast -Rxmin/xmax/ymin/ymax -Jproyection -GR/G/B -SR/G/B -Dquality > outputfilename
pscoast -R272/278/10/15.5 -JM15c -Ba2g2 -G245/245/200 -S140/170/235 -Lf273/10.5/10.5/100 -Dh -N1 -W1 -P -K >outputfile1.ps
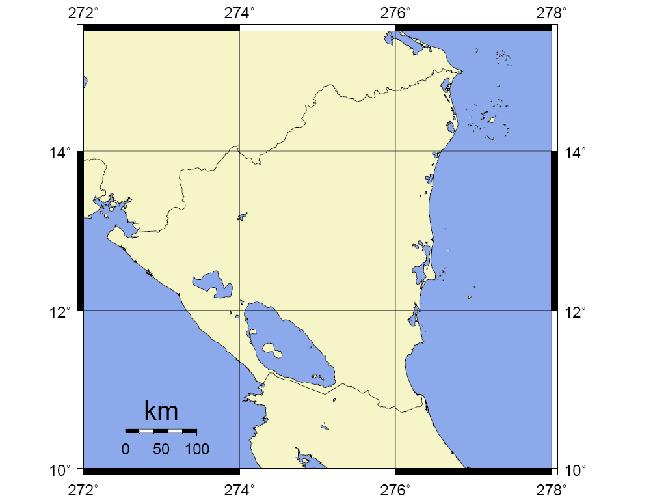
Figure 1. A simple map plot.
Ploting Focal mechanism
GMT has many useful tools, one of them is the psmeca.The function of this command is to plot focal mechanism.
you can get focal mechanism data from http://www.globalcmt.org/CMTsearch.html
There you should specify the date and the output file type that you select should be psmeca input.
the common parameters of the psmeca command are as follows
psmeca inputfilename -Rregion -Jproyection -GR/G/B -Smxc(size of the symbol in centimeters or inches) -Pfor portrait> outputfile2.ps
for example using the previous example
pscoast -R272/278/10/15.5 -JM15c -Ba2g2 -G245/245/200 -S140/170/235 -Dh -Lf273/10.5/10.5/100 -Dh -N1 -W1 -P -K >gmt2.ps
psmeca 2005cmt.gmt -R -JM -Sm0.5c/-1 -G0/0/255 -P -O -K>>gmt2.ps
pstext -R -JM -P -O -K <> gmt2.ps
274.2 13 18 0 1 LT Nicaragua
EOF
Here is the script for figure 2 focal mechanims

Figure 2. Focal mechanisms.
As you can see the text was added by using the "pstext" command.
Relief like plots
So far just "plane" have we seen.As mentioned before GMT is capable of produce relief like plots.
For making a relief like map, it is important to have topographic data.
a site where you can download it is http://edc.usgs.gov/products/elevation/gtopo30/gtopo30.html
This data "GTOPO30" are DEM type data so you must converted to GMT type before you proceed.
Here is a shell script DEM2xyz
After you have this data in xyz you should make a grid. This can be done by using the GMT command
xyz2grd as follows
xyz2grd inputfilename -Rregion -Idivision of the grid -Goutputfile0.grd -N-9999 -Vverbose mode to be able
to know what GMT is doing. Once we have converted the xyz data to grid we can make a illumination file for
helping enhance our map, for this purpose we use the grdgradient command
grdgradient inputfilename.grd -Ne.8(a function wich varies from 0 to 1 normalizes using a cumulative Laplace distribution)
-AAzimuthal direction for a directional derivative -Munits -Goutputfilename.grd
for example
grdgradient us.grd -Ne.8 -A100 -M -Gus_i.grd>gmt3.ps
and the next step is ploting all the previous results. Using grdimage command
grdimage us.grd -JM6i -P -B2 -Ctopo1.cpt -V -K -Ius_i.grd > gmt3.ps
psscale -D3i/8.5i/5i/.25ih -Ctopo1.cpt -I0.4 -B/:m: -O >> gmt3.ps
The last command(psscale)plot a color scale of the different elevations in the map
Here is the script for figure 3 USrelief

Figure 3. Relief like map.
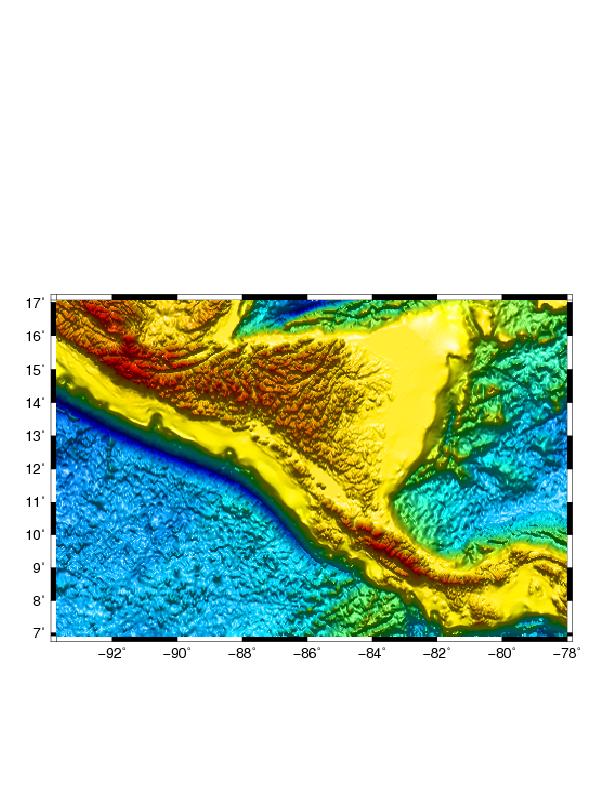
Figure 4. Relief like map.
Here is the script for figure 4 NICrelief
Again,for making a perspective like map, it is important to have topographic data.
Another site where you can download it is http://srtm.csi.cgiar.org/
Finally a more realistic map could be do it by using the command grdview
grdview inputfilename.grd -Jprojection -Eview_Az/view_el -Qtype -I1intesitygrid.grid -Ccolor palette -Vverbose mode
-Bmap boundary annotations and tickmark intervals5 -JZsets the vertical scaling>gmt4.ps
grdview 06.grd -JM12i -E272/10 -Qi50 -I18i.grd -Ctopo.cpt -V -B5 -JZ0.5i>gmt4.ps
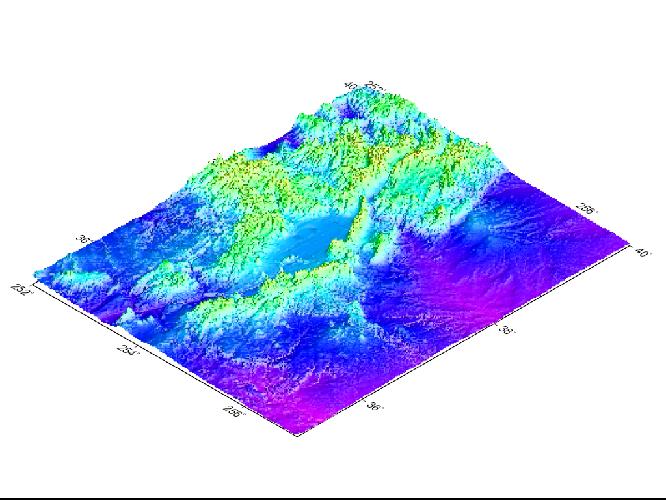
Figure 5. Perspective of a set of data gridded.
Of course the quality of the image will depend on the quality of the topographic data