
 Dave
Steppan's
Dave
Steppan'sDave
Steppan's
 Excel®
a la Carte
Excel®
a la Carte
VBA Tips and Tricks
The Goal of this Area is to provide some building blocks for those using Excel® VBA to develop solutions to problems.....
All code provided here has been run in Excel 97 on my computer. It is provided without any warranty or guarantee of any kind. Use any code at your own risk. Please EMail me any comments at dsteppan@yahoo.com (please note the new EMail address). In general, I am happy to try and give some hints on any Excel problems you may have. I do this as a hobby so please be patient if you EMail me. I don't always have the time to answer expediently but I do enjoy helping solve problems. To see some recently answered questions see my RAQ page.
The wizards that come with Excel are useful but often don't do exactly what we want. Some are useful in a quick and dirty way but they typically aren't improved or updated with each Excel revision. A quintessential example for me is the histogram macro. The problem with it is it is not linked to the source data. Each time the source data is changed the macro needs to be re-run. This seems to defeat the whole point of using a recalculating spreadsheet. The spreadsheet (standardnormal.zip) shows how to use spreadsheet array formulas to do the histogram binning and have a dynamic histogram. The basis for the array formulas came from browsing Chip Pearson's Excel Page. It also contains a custom function that samples a standard normal distribution (at least I think it does). Comments as to the accuracy of the standard normal function are welcome. Recalculate the sheet a few times and watch the histogram change.
Do you want to have a very flexible way of analyzing your mutual fund or stock portfolio? This workbook (Excel 97 stock.zip) allows one to do just that. It requires Web access from Excel but is very easy to use and provides a button which automatically gets current prices from www.pcquote.com. The user can dynamically add plots at any time of any set of securities he wants and change the date at he/she wants to start comparing them. Relative (1.00 being the start price of all securities on any user specified date) or absolute share price plots are supported. The plots automatically incorporate new data as it is acquired.
Did you ever want to sort a table with more than three columns or variables to sort? This is the upper limit to Excel's Data Sort command. The SortMultCols spreadsheet array function supports unlimited (ok I'm lying but I don't know how maliciously) number of columns to sort. It has some limitations (sorting only left to right in the table and only all ascending or descending) but provides some added utility to Excel® which can be very time consuming to obtain any other way. Thanks to Bob Yeater for insight on how to write the sort (Excel 97 multsort.zip). The VBA sorting algorithm is a modified one from the book Running MS-DOS QBasic by Michael Halvorson and David Rygmyr (ISBN 1-55615-340-6) in which they attribute it to the Shell Sort algorithms of Donald Shell which he invented in the late 1950's. Perhaps it is true, "all good code is borrowed".
Have you ever used a Lotus® Notes "database"? The Notes UI will not win any ease of use or design awards however, the hierarchical views of a data table are really convenient (and why they are not part of Access® is beyond me, as are most of my desires). Well you can achieve a similar functionality in Excel® (VBA really), using the TreeView control from the Microsoft Windows Common Controls OCX. This is demonstrated in this macro (Excel 97 treeview.zip) which also allows the user to save the hierarchical view he or she likes best to a spreadsheet. This allows for fancy formatting and printing. Expand and Contract buttons keep the spreadsheet TreeView from being completely static (and I think more useful). This was an excellent opportunity to use recursion to build the tree view but I can't seem to understand how to get recursion to work when I need it. Any advice here would be appreciated. This TreeView macro requires the above SortMultCols macro and is the main reason I conceived and wrote that macro. I think the TreeViewer is the best way to dynamically view a variety of data, not just hard-drive directory and file data. It would be excellent for organizational charts and software menu maps in addition to sales type data included in the sample.
Do you do many scientific or engineering calculations in Excel®? Wouldn't you like to have a handy way to convert units. Well I haven't solved all your problems but this macro provides a completely functional shell of a slightly populated unit converter. You can easily add the quantities of importance to your area of work. In addition, conversion factors can be added at any time. Within a few weeks this could be your own customized and very useful unit converter (Excel 97 unitconv.zip).
Do you need to calculate molecular weights from chemical formula's? This workbook (Excel 97 chemcalc.zip) allows one to calculate molecular weights directly in the spreadsheet with the CalcMW function. Alternately, the calculator can be run via a dialog box interface where it outputs weight and mole percentages of all elements in the compound. A database spreadsheet allows compounds of common interest to be stored and easily retrieved for later analysis.
Very often one wants a user to choose an item from a list box. However, if the list box has many items this can make for a clunkly and time consuming experience. What is desired is an autofill method from a linked text box. (Many may be familiar with the 'type ahead' feature in Intuit's Quicken® and now in Excel®). This VBA code demonstrates how to get this effect easily by using the MATCH function to find the item in the list box and the .SelStart and .SelLength methods of the text box to perform the autofill. Also has a wild card search feature to find substrings within the list box entries (Excel 97 searchastype.zip). The basis for the code comes from one of the best sources of Excel tips and techniques Stephen Bullen (with some help from Jim Rech).
On the subject of Stephen Bullen, he has shown how to create a virtual array by defining a name on the spreadsheet with an equation that uses the OFFSET function and evaluate this array in any legal Excel® equation using the undocumented EVALUATE function (at least I can't find in the help files or any book). This allows one to simply type in an equation any instantly see a plot of it. I have extended his technique to allow one to simultaneously plot three equations (Excel 97 plotfcn.zip). This can be very helpful to those studying algebra or calculus.
Did you ever have the need for an Excel Chart that automatically detects when new data is added to the spreadsheet and automatically is incorporated into the Chart. This is really a "classic" Excel problem whose solution is fairly well documented. The book Excel Expert Solutions by a very large soccer team (13 authors!!! ISBN 0-7897-0386-6) discusses it in detail on page 750. Of course Stephen Bullen has a download which also demonstrates a similar solution. Another Excel behemoth nerd, John Walkenbach also has also published the solution which involves using either a range name or series formula directly within the chart with the OFFSET and COUNT or COUNTA function recently in PC Magazine. My contribution to the melee is a VBA macro (Excel 97 xyscatter.zip) which takes a data table as input (header row in the first row with vertical data columns) that hides the ugliness and drudgery of making the chart. Menu driven with some historical stock market index data to start with although one can easily add his or her own data. Also the macro allows one to plot using a relative scaling by dividing each data series by the first point in the series. Another plot macro (Excel 97 xyygraph.zip) shows how to make a general XYY plotting routine where dropdown boxes allow the dynamic choice of X axis and Y axis variables which recalculate automatically through native Excel spreadsheet recalculation. This is done by defining a named range with the OFFSET function that references the LinkedCell of the dropdown. This make for a general graphing macro with very little code and overhead. Again this graph will automatically incorporate new rows of data via the previous technique.
Also in Excel Expert Solutions is a technique to read and write two dimensional VB arrays directly to and from a worksheet. They are shown in this short VBA macro (Excel 97 readwritearray.zip).
In the old versions of Excel (5 and 95) with their dialogsheet constructs it was nice to be able to grab all the option buttons on a form with a command like Set OptButs=activedialog.optionbuttons which is conveniently not possible in the new improved version of Excel with its UserForms. However, if you download this workbook (Excel 97 Enumerate.zip) you can use a very similar custom function to return a collection of option buttons Set Cntls = GetControls(Me, "OptionButton"). Many thanks to Bob Yeater for his help on this and so many other programming issues.
Another Bob Yeater inspired routine (Excel 97 Resize.zip) allows you to resize your forms and automatically resizes all the controls on it properly and adjust the font size of objects appropriately. The original idea of mimicking the very popular "Elastic" ocx with pure VB code was gotten from Visual Basic Programmers Journal in an article by Franceso Balena.
If you ever wanted to simply manipulate the menus in Excel 97 to launch your macros you are probably missing the Menu Editor from Excel 5/95 real bad. Not only is it far klunkier to achieve this effect the on-line VBA documentation is spectacularly poor on this subject. Menu.zip (Excel 97) shows you how to hide the main Excel menu and show your own.
One of the best Excel web sites especially for advice and examples of using spreadsheet functions to do many things which do not seem possible is Chip Pearson's Excel Page. An example, which amplifies some of his techniques, shows how to find and count unique entries in a list (as well as determine the number of occurances of each entry) is given in this macro (Excel 97 unique.zip).
Recursion in code can be very powerful. I think the spreadsheet analog to this is iteration with those typically dreaded circular references. This macro (Excel 97 ode1.zip) shows how the power of iteration in an Excel spreadsheet can be used to numerically integrate a function. This is a general numerical integrator, albeit a very simple Euler step type, into which any function that can be evaluated in Excel can be integrated. It can be modified to use a higher order (Runge Kutta) type integrator for faster convergence but I don't think that is necessary given the trivial way the number of integration steps can be increased.
This idea of using iteration to integrate is fairly well known. Recently, I came across Excel for Scientists and Engineers by William J. Orvis (Sybex ISBN 0782117619) which expanded this techniques to solving Partial Differential Equations (PDEs) by using a series of Ordinary Differential Equations (ODEs). The book is a real gem for those who want to use Excel primarily for scientific work. I have expanded the technique of Orvis to solve the classic diffusion equation in one and two dimensions (Excel 97 ode2.zip). Here I have used the Method of Lines to translate the PDE into a series of ODE's. A centered finite different scheme is used. The basic equation has been non-dimensionalized in accordance with classical chemical engineering techniques. A real interesting way to "see" heat or mass diffusing. This technique has real potential for teaching the underlying physics of everyday problems.
Excel can readily be used to solve systems of linear equations with its built in matrix math handling functions (MMULT, TRANSPOSE, MINVERSE). This spreadsheet shows how (Excel 97 solvelinear.zip). Orvis's book also contains a section on doing this.
Did you ever need to make a Gantt chart? If you have, and checked into the price of Microsoft Project you would think that's a real expensive way to make a bloody Gantt chart. Here is an Excel macro that makes a very value priced Gantt chart in a painless manner (Excel 97 gantt.zip). It could be more beautiful but couldn't be cheaper.
Did you ever have a long VBA based calculation, or database retrieval and formatting operation? Very often you would like the user to see a progess bar display in a dialog box that would disappear when the process was over without the user having to click any buttons. Jim Rech posted a way to display and dismiss a dialog box automatically in the Compuserve Excel forum (I can't find a his Web Site so I can't give a hyperlink). He indicates that the technique is based on Microsoft knowlege base article Q162257 (I haven't been able to verify this since I can never get anywhere on the Microsoft web site in a timely manner. This doesn't bother me much since I'm sure it will be completely different next time I browse it.). I have used his technique here (Excel 97 progress.zip) adding a progress bar and a Cancel button which interupts the macro.
With Excel 97 came that obstrusive Office Assistant which some appreciate more than others. However, the Assistant comes with an easily programmable object model and can be used for simple help files. This method has advantages over the new Microsoft HTML help format (requires some ActiveX controls which hardcore Netscape people do not have) and a traditional help file (need to compile and distribute another file). The Office Assistant can provide context sensitive help (in this case each form has its own initial and set of response balloons) and be displayed non-modally (is that a word?) or allow the user to simultaneously continue working and view the help balloon. The macro (Excel 97 balhelp.zip) helps those new to the Office Assistant get started and evaluate the approach. All information for the entire help system is stored in an Excel spreadsheet database. A graphical front end for creating and testing the help balloons (which updates the underlying balloon spreadsheet database) is provided. The idea for this macro came from an the article Program the Office Assistant - Add context-sensitive help and smart error handling to your applications. It was written by Craig Meese and appeared in ACCESS-OFFICE-VB ADVISOR in May 1998. The article showed a nifty MS Access implementation of the Office Assistant.
Regression Section
Did you ever want to do automate some curve-fitting and correlation in Excel right on the spreadsheet or with VBA code? Most people are aware of the clunky Excel Regression macro that is availabe in the Data Analysis Toolpak add-in. However, many don't realize that linear and in fact multiple regression is possible directly on a spreadsheet via the LINEST function. This array formula function is a bit awkward to use on the spreadsheet until one gets familiar with it. It is doubly difficult to use from VBA. These macros (Excel97 Linest.zip and Linest3.zip) show how to use LINEST function both on the spreadsheet and from VBA to perform regression in an automated manner in contrast to the usual dialogbox driven approach. If you want to perform automated data analysis with concommitant graphs this macro will give a solid starting point. Some general methods of calling Excel's matrix functions from VBA and from the spreadsheet are covered.
Did you ever wonder what class modules are for and how they might be useful? Here is an example of a workbook that utilizes a class to do regression (Excel97 Class.zip). Run the subroutine TestRegression to see how the class may be called and run. This routine must be modified (see the comment from Chip Pearson via an internet newsgroup response) slightly to be called from another (external) workbook. This can be seen in the calling Excel workbook also in the zip file.
In our book Essential Regression and Experimental Design we go through the gory details of exactly what LINEST is doing when you call it to bring back the regression coefficients. One can achieve that identical results by simply using Excels built-in matrix math operators (called via array formulas). This is just an alternate way to achieve the same end. However, several people have asked how can a regression to run in native visual basic (VB) or in Access (VBA). By writing all the necessary matrix math functions in pure Basic in this macro (Excel 97 Linest2.zip) will allow you to curve fit in other VB environments (speed and error trapping not withstanding). The macros shows how to write your own custom array formulas and illustrates the oddities of nesting custom array formulas.
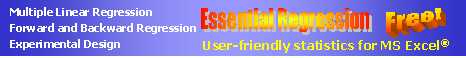
Would you like to perform Designed Experiments, Data Analysis and Regression in Microsoft Excel®? If so please check out Essential Regression, a free software package and book which performs linear regression, multiple regression, polynomial regression experimental design in a user-friendly GUI tool in Microsoft Excel.
Other WWW Excel Resources
The best overview of high quality Excel resources on the Web is the John Walkenbach Excel Page (if the name seems familiar its because he lives, breathes and exudes Excel in columns, books, software, Website) and his Excel Links page. I highly recommend you visit his site if you are interested in Excel VBA coding. I also highly recommend Chip Pearson's site and Stephen Bullen's page .
This page hosted by ![]() Get your own Free Home Page
Get your own Free Home Page