Use jeans.txt
or full_fig7.txt,
but change fig7-nh.txt to a simulated AR1 process with p=0.77.
Run N times. Result after
10 runs:
After 100 runs:

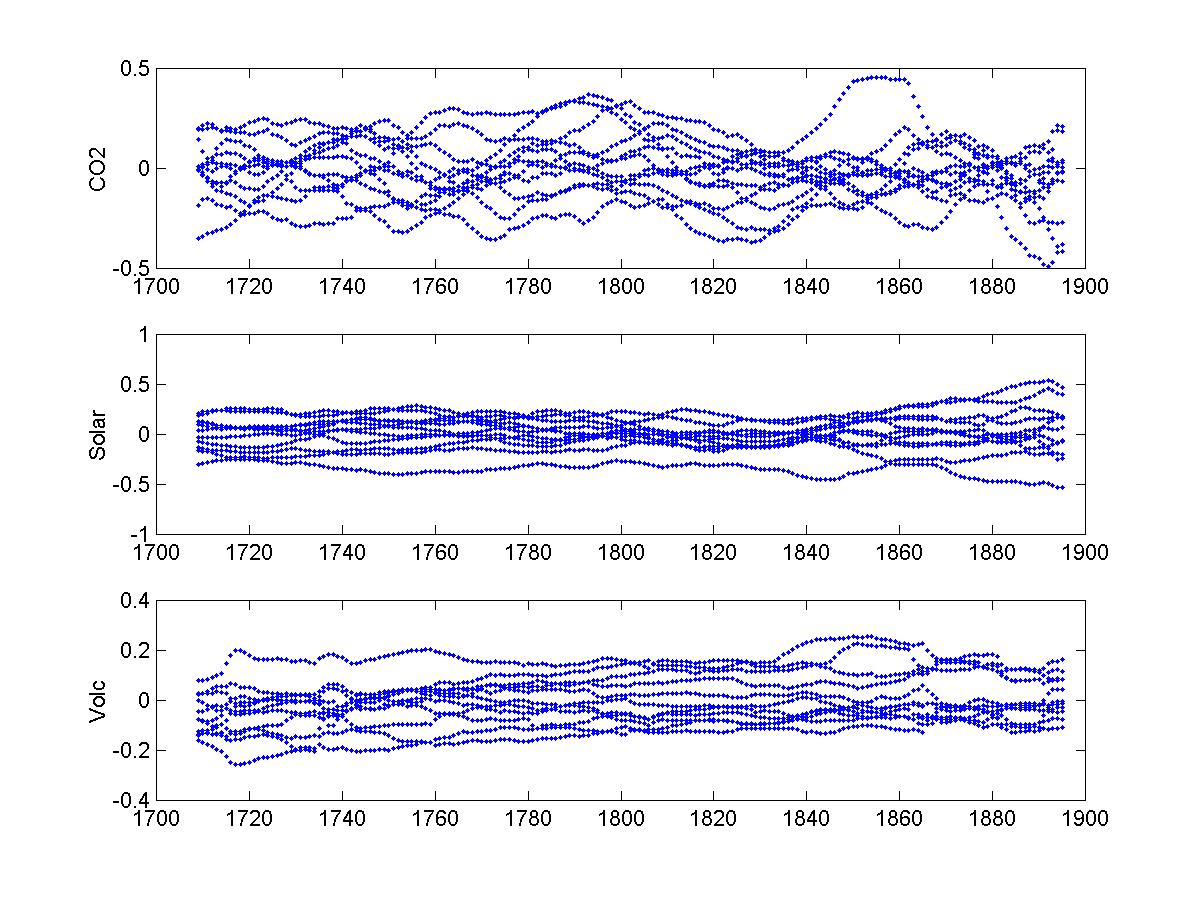
Then just sort all the results and check where the 90, 95 and
99 % limits are. After 10 000 runs I got [0.26 0.34
0.47] for CO2, [0.25 0.32 0.45] for Solar and -[0.14 0.17 0.25] for
Volcanic. MBH98 values were
[0.24 0.31 0.41] for CO2 and Solar, and -[0.16 0.20 0.27] for Volcanic. So, what do these limits mean? There are non-AR1 parts in the NH reconstruction.