dataall.txt, data source
Load dataall.txt, and you'll have 581 X 416 data matrix. Explanation is in README.txt,
There are lots of NaNs, but if you take period 1861-1960, you'll be safe.
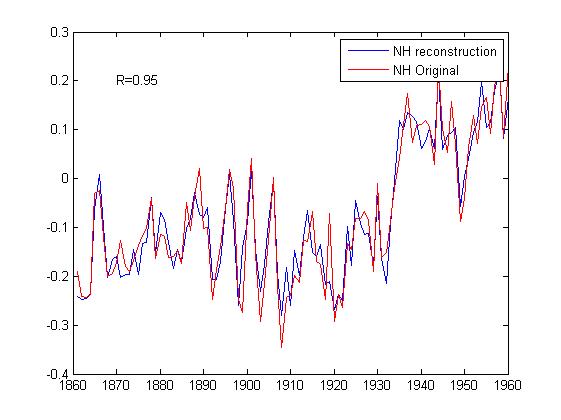
Let's order those proxies according to correlation with NH Temperature, and take 20 'best proxies'. LS fit with those
20 proxies will look like this:
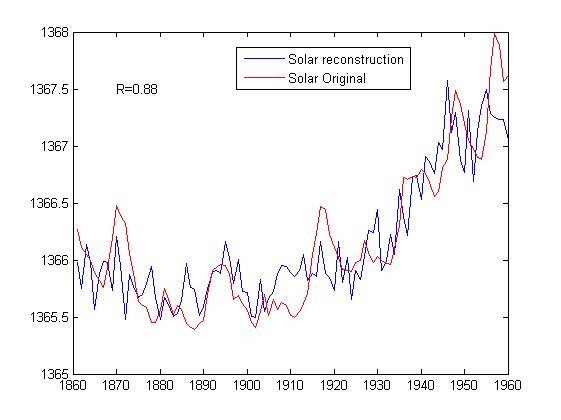
Quite close. Let's order those proxies according to correlation with solar, and take 20 'best proxies'.LS fit with those
20 proxies will look like this:
Code Here