| Topographic Maps |
Definition: "Maps that present the horizontal and
vertical positions of the features represented; distinguished from a planimetric
map by the addition of relief in measurable form."
One of the most widely used of all maps is the
topographic map. The characteristic that distinguishes topographic maps
from other maps is the use of contour lines to portray the shape and elevation
of the land. Topographic maps render the three-dimensional ups and downs
of the terrain on a two-dimensional surface.
Topographic maps:
Show the size, shape, and elevation
of land
Show cities, bridges,
roads.....
 |
Shows the size, shape, and elevation
of land
Shows cities, bridges, roads.....
Parts of a Topographic Map
Contour lines
 |
Lines on a topographic map that connect points of equal elevation. The lines with the numbers are index contour lines. |
Contour Interval
 |
The difference in elevation between two side by side contour lines. The contour interval here is 5 feet. |
| Close Contour lines = a steep elevation |
 |
Hills - closed curves of decreasing size. Inner curves are at higher elevation than outer curves, and the peak is within the innermost curve. |
| Valleys - these appear as a series of "V" shaped curves. The point of the "V" always points toward the head of the valley, and when there are streams in the valleys the "V" points upstream. |
 |
Saddles - The space between peaks can be recognized by its hourglass shaped contour lines |
 |
Cliffs - since they represent dramatic changes in elevation over a short horizontal distance, cliffs are represented by closely-spaced contour lines. |
 |
Depressions
or holes are marked by hactures.
Hachures- Short lines used on a map to indicate a depression |
Gentle slopes - slow rises in elevation
over a long horizontal distance are represented by widely-spaced contour
lines.
Map Scales

Scale is represented in two different ways
on a topographical map. The first is a ratio scale. The ratio scale on
this map is 1:24,000. What it means is that one inch on the map represents
24,000 inches on the ground. Below the ratio scale is a graphic scale representing
distance in miles, feet and meters. The graphic scale can be used to make
fast estimates of distances on the map. The space between the 0 and the
1 mile mark on the scale is the distance you must go on the map to travel
one mile.
The most important consideration in choosing a map, with its defined map scale, is its intended use. Different scale maps provide different levels of detail in terms of features presented.
Simply defined, map scale is the relationship between distance on the map and distance on the ground. That is, there is a direct relationship between a unit of measurement on the map and the actual distance expressed in the same unit of measurement on the ground.
The USGS has produced topographic maps for
the entire country at different scales. The most commonly used topographic
map produced by the USGS is the 1:24,000-scale quadrangle map. These maps
cover 7.5 minutes of latitude by 7.5 minutes of longitude. Maps at
this 1:24,000-scalescale provide detailed information, including the locations
of major roads, rivers and lakes, vegetated areas, boundaries, and important
buildings, as well as campgrounds, caves, ski lifts, watermills, and even
drive-in theaters. Footbridges, drawbridges, fence lines, private roads,
and changes in the number of lanes in a road are also shown at this scale.
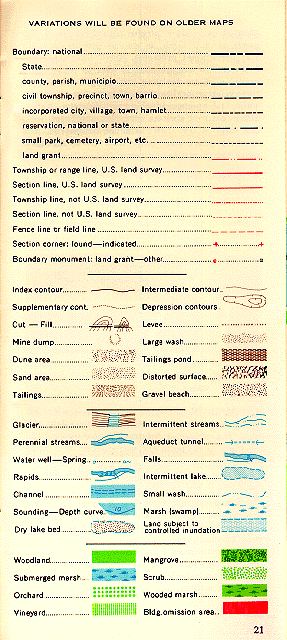
Legend
Map legends are keys used to interpret
maps.
The legend tells you what the various
symbols and colors used on the map represent. The legend is often overlooked,
but it contains a lot of useful information. Symbols, defined in the legend,
are used to represent features such as cabins, campgrounds, waterfalls
and bridges.


