 Electrocardiography
| Introduction | How It Works | Rhythms | References and Links |
Introduction

What is it?
Electrocardiography, is a non-invasive procedure for recording electrical changes in the heart. The record, which is called an electrocardiogram (ECG or EKG), shows the waves of heart rhythm, and the results are either printed or displayed on a monitor. ECG enables us to see whether the rhythm is regular or irregular, and to pinpoint the trouble spot if there is any.
Setting It Up
In 12-lead ECG, which is commonly used for diagnostic purposes, ten electrodes - four on each extremities and six on the chest - are placed on the patient's skin, which senses the electrical current from the heart. Now, you may wonder why is it called 12-lead ECG if there are ten electrodes? The trick is in the meaning of the word "lead." ECG is basically looking at the heart from various views, and the lead is the direction of the view. By using ten electrodes placed on extremities and chest, ECG creates twelve different views to look at the heart. We'll get into more detailed discussion on leads in later section. For now, let's talk about where to put those electrodes.
- Limbs Once you straighten out those long cables of electrodes, you'll discover four of them are much longer. These are placed on each extremities and they are conveniently labeled and color-coded for you. White is RA (right arm), green is RL (right leg), red is LL (left leg), and black is LA (left arm).
- Chest The rest six are labeled V1 through V6, and their placement is as shown on the right.

Notice that there are several sections of rhythms with labels I, II, III, aVR, aVL, aVF, V1, V2, etc, showing slight variations on the rhythm's shape. Those labels are the leads, or different views of the heart. We'll take a look at those more closely next.
How It Works
The basic principle behind ECG is that an electrical current towards positive pole creates upward deflection on the ECG paper and the greater the current (more myocardial cells), the more positive the voltage (higher amplitude of the wave on ECG). Likewise, if the electrical impulse travels towards negative pole, there will be downward deflection on the ECG. When there is no electrical activity in the heart, or if the electrical forces are equal, the ECG tracing will show a flat line. This line is called the isoelectric line, or baseline, which is used as reference point to evaluate the waveforms.
We'll first take a look at the leads formed by the electrodes that were placed on arms and legs. Because our extremities act like electrical cables, those electrodes will behave as if they were on the shoulders and groin area.
Bipolar Limb Leads
These leads are also called standard leads, probably because they are most frequently used, especially for continuous monitoring.
The name is bipolar because one of the electrodes that were placed on each limb acts as a negative pole while another acts as a positive pole, and ECG wave from these "views" reflect a change in electrical potential between these two points. There are three different views possible by using limb electrodes:
-
Lead I is between RA (right arm) and LA (left arm), with LA electrode as the positive pole. With lead I, imagine yourself looking at the heart from LA, the positive pole. As the heart's electrical impulse flows towards you, the ECG paper would show a wave shooting upward.
Lead II is between RA and LL (left leg), with LL electrode as the positive pole. This time, you are looking at the heart from LL which is the positive pole in this particular lead. This lead is the most popular view when monitoring patients. Can you guess why? The direction of this view (from negative RA to positive LL) is the closest to the natural flow of the impulse of the heart (from SA node at upper right to Purkinje fibers at lower left). Therefore, when you are looking at the heart from LL, the heart's electrical impulse is flowing right towards you, meaning that waves on ECG paper would appear clearly.
Lead III is between LA and LL, with LL as the positive pole.
Unipolar Limb Leads
 The same three electrodes that formed bipolar limb leads can also provide a slightly different set of views. Unipolar limb leads are also called augmented limb leads.
As the name implies, unipolar leads detect changes in electrical potential at one point only (remember bipolar leads detect electrical changes in relation to the direction of negative electrode and positive electrode.)
There are three different unipolar limb leads.
-
aVR provides view of the heart from RA. You are looking at the heart from upper right corner. If you compare the rhythm strip of lead II and that of aVR, you'll notice that aVR is a complete opposite of lead II (i.e. a wave shooting upward in lead II will be shown downward in aVR.) That is because, as you've probably guessed, you are looking at the heart from the opposite direction. Unlike in lead II where the heart's natural electrical flow was coming right at you, in aVR, heart's electrical current is moving away from where you're looking.
aVL provides view of the heart's electrical activity from LA, the upper left corner.
aVF provides view of the heart from below, left leg.
| So far, we've looked at six different leads - I, II, III, aVR, aVL, and aVF. These leads look at the heart on a frontal plane. We need more views, however, because heart is not a flat object. We need more views from different perspective in order to see the 3-D picture, and that's where the next six leads come in. |
Unipolar Chest Leads
 The electrodes that were placed on the chest provide the leads V1, V2, V3, V4, V5, and V6, which are also called precordial leads. These leads are also unipolar, and you are looking at the heart from the point where each chest electrodes were placed. By using precordial leads, you are able to see the heart's electrical activity on a horizontal plane.
The picture on the left shows how precordial leads slice through the heart horizontally.
Putting It All TogetherBelow picture shows how all the twelve leads relate to the heart.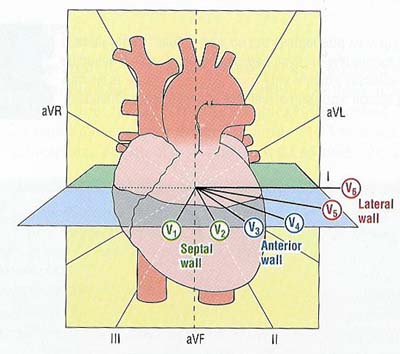
|
|
So we now know there are 12 leads looking at the heart from different directions. Now what? How do they aid us when something is wrong with the heart? Some conditions of the heart can be more visible with certain leads than other leads. Also looking at different leads provide location of the problem. Suppose you discover leads II, III, and aVF are showing rhythm changes consistent with myocardial infarction. Which part of the heart are those leads looking at? They are facing the bottom of the heart. Therefore, you'd know that it is inferior wall myocardial infarction. Now you are seeing the changes in lead V1 and V2. They run along the septum - hence, a septal wall MI. |
Rhythms
Here's a piece of ECG we're all familiar with: For a quick review, let's go over components of ECG rhythm.
P wave is created by atrial depolarization.
PR intervalrepresents transmission of an electrical impulse from the SA node through the atria and AV junction.
QRS complex represents depolarization of ventricles and their subsequent contraction.
ST segment, from completion of QRS complex to the beginning of T wave, represents the start of the repolarization of the ventricles.
T wave represents the repolarization of ventricles.
You might come across what is called U wave. It is not clear what it represents, and it is difficult to identify, frequently causing miscalculations in ECG readings. I was told that it is related to electrolyte imbalance. Who knows?
If you have relatively fast internet access and Shockwave application, I strongly recommend this site, by medical folks at NYU. It will take you directly to the section where you can watch process of depolarization and repolarization at the same time with ECG rhythm.
| Now let's take a look at some rhythm strips. Following rhythms are as seen on lead II. | |
This is the most favorable rhythm, Normal Sinus Rhythm. Important features of NSR are QRS rate of 60-100 beats per minute, regular rhythm, nice and round P wave - which means SA node is functioning properly, normal QRS width (0.04-0.12 sec), normal PR interval (0.12-0.20 sec). Keep in mind one small box equals 0.04 seconds. |
Sinus Bradycardia In sinus bradycardia, everything is normal except slow beats (<60bpm). You can see the interval between each QRS complex is much wider than that of normal sinus rhythm. |
Sinus Tachycardia Everything is normal in sinus tachycardia except faster rate (>100 bpm). See how narrow the space between QRS complexes? |
Atrial Flutter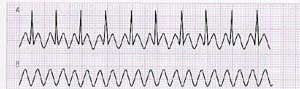 Atrial Flutter's trademark is the saw-toothed appearance. The QRS rate is usually regular and the complexes appear at some multiple of the PP interval. Second rhythm in the bottom shows the shape of P wave with QRS removed. |
Atrial Fibrillation This is the chaotic firing of numerous pacemaker cells in the atria in a haphazard fashion. The result? No discernible P waves, irregular pattern of QRS complexes. |
Junctional Rhythm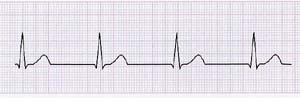 This occurs when the normal pacemaking function of the atria and SA node is absent. AV node takes over the task and because the rate that AV node can generate is slower (40-60 bpm), you can see the overall drop of heartbeat. Also notice that there's no P wave, since SA node is not functioning. |
Premature Ventricular Contraction PVC is caused by the premature firing of a ventricular cell before the normal pacemaker cells. The underlying pacing schedule of SA node is not altered, so the beat will return to normal rhythm. PVCs can occur as a single event, several times in a minute, in pairs or strings. Three or more PVCs in a row will be then called ventricular tachycardia |
Ventricular Flutter When ventricular tachycardia becomes very fast (200-300 bpm), and you can no longer tell if it is QRS complex, a T wave, or an ST segment, then you have ventricular flutter. VFlutter can quickly deteriorate into VFib. |
Ventricular Fibrillation In other words, cardiac chaos! There's no organized activity here. Imagine the heart looking like shaking jello. If not quickly treated, it will go flatline. |
Asystole Do I need to say more? |
First Degree Heart Block Also called first degree AV node block since it is AV node that is malfunctioning. Excessive delay in AV nodal conduction causes prolonged PR interval. Notice PR interval is greater than 0.20 second. | |
Second Degree Heart Block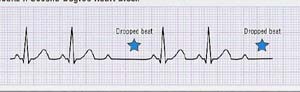 In this case, AV node is diseased, so some impulse passes through with resulting ventricular contraction, and some don't. | |
Third Degree Heart Block This is complete block of AV node; the atria and ventricles are firing separately each to its own drummer. The sinus rhythm (by SA node) can be bradycardic, normal, or tachycardic. The escape beat can be junctional (40-60 bpm) or ventricular (20-40 bpm), and so their shape will vary. | |
References and Links
Useful Links
Dr. Joseph F. Smith Medical Library ECG procedure and types of arrhythmia are explained in laymen's terms.EKG Tutorial Wonderful tutorial course with Shockwave presentations.
A Guide to Reading and Understanding the EKG Similar to the above site. Page 3 and 4 of this presentation show some good illustrations of different leads as well as links to view the heart in 3-D.
Credits
Fox, Stuart Ira. Human Physiology. 7th ed. New York: McGraw-Hill, 2002Garcia, Tomas B., and Neil E. Holtz. 12-Lead ECG. Sudbury, MA: Jones and Bartlett Publishers, 2001
Sincere thanks to Suwanee, Clinical Educator and Jill, Cardiology Lab Supervisor at Daniel Freeman Memorial Hospital!
mikeyesol@hotmail.com
Human Physiology, SMC
| Introduction | How It Works | Rhythms | References and Links |