1. Explain what causes tides (click here for animation).
2. Greatest range. Draw the position of the Sun, Moon and Earth when there is a spring tide (highest high tides and the lowest low tides of each month). (click here for animation)
3. Smallest range Draw the position of the Sun, Moon and Earth when there is a neap tide (lowest high tides and the highest low tides of each month). .
3. Explain why high and low tides are not at the same level every day.
4. Explain why each day the high and low tides occur a few minutes later than on the previous day.
5. Explain why the Moon looks different each night as the Moon goes through its monthly orbit of the Earth. (animation)
6. Add a drawing to each diagram above that shows the phase of the Moon when those those tides occur.
Tidal Range exercise: use the graph of predicted tides in
Bridgeport harbor
1. Mark the 2 days that had "Spring" Tides and the 2 days of Neap Tides on the graph.
2. Mark when the New Moon, the 1st Quarter Moon, the Full Moon and the 3rd Quarter Moon occurred.
3. When would the arrival of a 2 meter storm surge not cause any flooding? Why? Label this time on the graph.
4. When would the arrival of a 2 meter storm surge cause the most damage? Why? Label this time on the graph.
5. Explain how wind strength and direction may cause the actual tide levels to be different than predicted (http://tidesandcurrents.noaa.gov/data_menu.shtml?bdate=20070203&bdate_Month=1&edate=20070209&edate_Month=1&datum=6&unit=1&shift=g&stn=8467150+Bridgeport%2C+CT&type=Tide+Data&format=View+Plot)
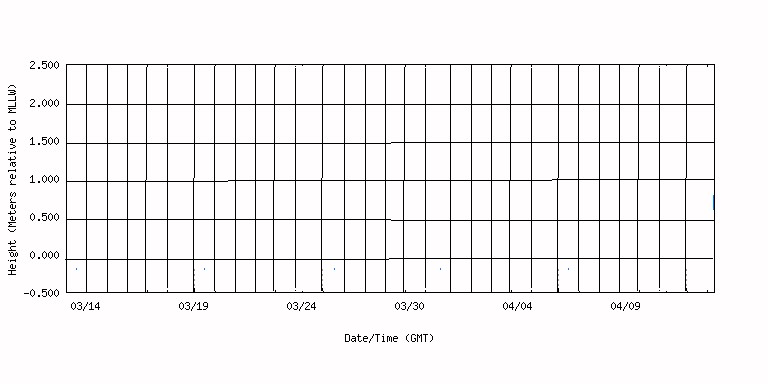
Predicted Tides in Bridgeport Harbor from http://tidesandcurrents.noaa.gov/cgi-bin-mp/data_plot.cgi?mins=60&datum=6&unit=1&stn=8467150&bdate=20080310&edate=20080410&data_type=pr&shift=g&plot_size=large
Actual water level over the past month
Following is a graph of the predicted tides for the next month.
1. Mark the 2 days that will have "Spring" Tides and the 2 days of Neap Tides on the graph.
2. Mark when the New Moon, the 1st Quarter Moon, the Full Moon and the 3rd Quarter Moon occur.
3. On the blank graph that follows, plot the actual low and high tide levels and when the New Moon, the 1st Quarter Moon, the Full Moon and the 3rd Quarter Moon occur over the next month. Use the information at: http://tidesandcurrents.noaa.gov/data_menu.shtml?stn=8467150%20Bridgeport,%20CT&type=Tide%20Data
4. Check weather conditions to explain any days when the actual tide levels were different from the predictions.
