
Lecture #1 ---
Monday October 26, 1998
Model can be used to make predictions about how epidemics propagate and about how to control them.
Why build a model? To answer questions like:
What is a scientific model? It’s something like a play, but instead of following a script, the players follow a set of strict rules.
3. Set the initial scene and put it in motion.
4. Watch what happens in your model world.
5. Draw conclusions about the relationship of the model world to the real world.
6. Adjust the model if necessary and try again.
What is the difference between a hypothesis and a scientific model?
Building models is what theoretical physicists do for a living. Epidemiologists do the same, but instead of modeling the behavior of atoms and quarks and black holes, they model the behavior of people, animals, plants, and infectious agents like germs, viruses, and parasites.
To illustrate this idea, I’m going to start by telling you about how an epidemic might move through an orchard of apple trees.
Choose the players.
1. My players are trees that sit on a flat landscape. I’ll put them in neat rows and columns.
There can be some empty spaces also.
There is a "disease" that jumps from tree to tree. It can only jump between trees that are very close neighbors.
2. Choose the rules.
The game moves forward in steps. At each step, the disease infects all trees that are right next to an infected tree.
Once a tree is infected, it stays infected.
The game is over when the "epidemic" is finished and no new trees become infected at each step.
3. Set the initial scene and put it in motion.
One tree on the edge of the orchard is infected. The epidemic spreads from there.
4. Watch what happens in your model world.
How far does the epidemic get? What does that depend on?
5. Draw conclusions about the relationship of the model world to the real world...
6. Adjust the model if necessary and try it out again…
Epidemic: an infection or disease that affects a large fraction of the host population

2. Choose the rules.
The rules describe how disease is transmitted from infected to susceptible individuals, how long it takes for susceptible individuals to become contagious and present symptoms, how long it takes for infected individuals to either get better or die, etc.
E.g. we start with one person sick and everyone else in the community is susceptible.

The goals of building a scientific model are:
Use birthday for probability
This model is model of connectivity.
Density is the critical parameter!

Percolation threshold depends on type of rows and columns (different kinds of lattices have different thresholds.)
In your lab over the next two weeks you will use a computer simulation tool to estimate the percolation threshold for several different lattices.
What adjustments could we make to this model?
a) Wind propagates from west to east. Disease only moves to the right, never backwards to the left.
b) Disease can occasionally jump a long distance.
What else can you think of?
Right at the threshold, the percolating cluster is a "fractal," which means it has a scale symmetry: its features have smaller features, which have yet smaller features, and so on. It looks the same close up and far away.

This model could apply equally well to
Can adjust the model to describe different systems to different levels of accuracy.
Monte Carlo methods: flipping coins, throwing dice, pseudo-random number generators

Lecture #2 ---
Friday October 30, 1998
Students who were in computer lab on Wednesday showed me that many of them do NOT know what it means to analyze data by making a graph by hand.
A graph answers the question: how does one quantity vary as a function of another? Or in our case, how does the frequency of finding a percolating cluster depend on the density p? In order to perceive this relationship, the data have to be organized properly.
On the lab sheet, each student has to lay out the labels on the horizontal axis of several graphs. To lay out the axis labels, find the max and min values of the relevant variable you need to graph, and the number of intervals you have on your graph paper, and use your head to figure out how to create evenly spaced axis labels. Then plot your data and draw a line through the curve.
(Give an example of a graph done wrong and explain why it’s wrong and how to fix it.)
Introduce the "Cayley tree" model of percolation: a tree structure that keeps branching out without ever making a loop, where you can calculate the percolation threshold explicitly and it is 1/z where z is the coordination number.
What kind of systems could we have in mind for a percolation model?
Requires that transmission of disease comes simply from proximity to someone who is already infected and is contagious.
But not all diseases are transmitted that way. Some are food-borne or water-borne, and if food or water is transmitted long distances, you might have transmission from people who are not physically close to each other. Or if one person is preparing food for many you might have an instant epidemic, which is totally different from one which propagates from person to person along a chain.
Just a quick mention: Self-organized criticality
Right at the percolation threshold, the percolating cluster is a fractal. It has scale symmetry. This means that a small part, blown up, looks much like the whole thing, e.g. it has no characteristic length scale. But there is no obvious reason why a naturally occurring system would happen to have a density near its percolation threshold.
Is there some dynamic process that naturally adjusts the density toward the critical value?
Disease outbreaks come in all sizes; we only call them epidemics if they are relatively large. Let’s go back to the forest fire model for a minute and talk about the distribution of forest fires sizes.
Imagine that a big flat piece of land is dotted with trees scattered at random. New trees sprout at random wherever there is empty space (the seeds are dropped all over by birds) and every so often a lightning bolt sets a tree on fire and all the trees in the local cluster burn down. But after a time new trees grow to fill in the empty space. Over time this system will have many small fires, whenever lightning happens to hit a tree in a small cluster. Only occasionally will it have a really big fire.
This means the system naturally seeks a state in which there is no characteristic fire size. You have a distribution of fire sizes which depends on the scaling exponent alpha.
The same thing happens with epidemics. Imagine an epidemic of chicken pox, a disease that normally doesn’t kill most kids and from which they are immune after a single infection due to the development of suitable immunological protection. After an infection runs through a community, a large fraction of the kids will be immune, which will keep the infection at bay for some time. Gradually as more kids are born or move to the community, the density of susceptible individuals will rise again until another epidemic can sweep through.
In the class on global change we will investigate the policy issues about whether it is a good idea for humans to fight forest fires or let them burn, so that the forest density seldom gets high enough to cause a large fire. In human terms few people would recommend that it’s a bad idea to fight epidemics because that’s just Nature’s way to keep the density of human habitation from getting too high, just as periodic small fires keep the density of the forest down.
However some people argue that the chicken pox vaccine is a bad idea. For one thing, no one knows if it gives true life-long immunity, so a whole generation of young people may find themselves susceptible to an epidemic in early adulthood, when they are more likely to sustain permanent harm from a chicken pox infection. Second, some people think that the vaccine only works if the immune response to chicken pox is activated occasionally, e.g. your immune system won’t maintain its defenses against chicken pox if it is never exposed. If we vaccinate all children routinely then there will not be much chicken pox virus floating around and people will not be occasionally exposed and may lose their vaccine-induced immunity.
So in this case some pediatricians argue that chicken pox is one epidemic we just shouldn’t fight. (Some families even try to expose their kids on purpose to get it over with!) This is something like the idea of not fighting forest fires—better to let Nature take its course because the system evolves toward a natural state which is reasonable if not completely optimal.
Mathematical models of epidemics try to predict the future. Look into my crystal ball. (Should I have come dressed as a gypsy fortune teller? Madame Selinger…)
Frankly, a computer is a lot more useful than a crystal ball when it comes to predicting the future. The language of fortune-telling is the language of dynamical systems.
Let’s start the math with something everyone can understand: bank accounts earning compound interest.
S(0)= $100.00
S(1)= S(0)*(1+r) r=daily interest rate=annual interest rate/365
S(N+1)=S(N)+ S(N)*r
(Explain what compounding daily/weekly/monthly is all about.)
Epidemics also have exponential increase in the early stages. Why is that?
The early stages of an epidemic can grow the same way as a bank account. The number of new cases is proportional to the number of old cases.
S(N+1)= S(N)+r S(N)= S(N) (1+r)
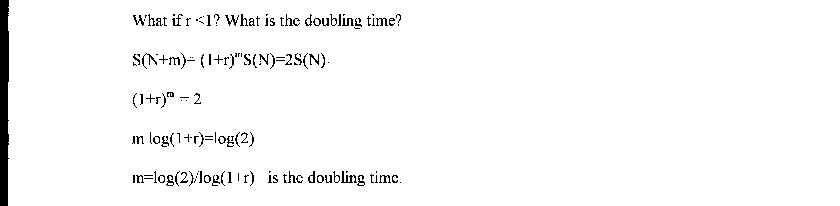
The parameter r tells us how many new cases come from each existing case. For instance if r=1, then for everyone who is infected a new person gets infected each day, so the number of sick people doubles each day:
So for instance if r=0.1 then m=7.27 days to double
Day0 S=100
Day 1 S=100+10=110
Day 2 S=110+11=121
Day 3 S=121+12.1=133.1
Day 4 S=133.1+13.31=146.41
Day 5 S=146.41+14.64=161.05
Day 6 S=161.05+16.10= 177.15
Day 7 S=177.15+17.71=194.87
Day 8 S=194.87+19.48=214.36
How do we do a better job describing the increase in the number of new cases each day?
S(N+1)=S(N)+ r S(N) [1-S(N)] where r is the contact ratio.
Number of new cases is the number of sick times the number of susceptible time a constant of proportionality.
More about the percolation model: 


Dynamical systems:
Example: if rate=5% annually, r=0.05/365= 0.000137 
What keeps an epidemic from doubling forever? For one thing, you run out of susceptible people. Like a chain letter or a pyramid scheme it can’t go on doubling forever without simply running out of people.
 Click here to go to the Archives Page!
 Click here to fly back to the home page!