 DEM and AVHRR data, along with rivers from the CIA World
Database II, combined for a model of Europe in July 1993. Lake Bodensee
where Germany, Swiss and Austria meet. At the bottom you can see the foot-hills
of the alps.
DEM and AVHRR data, along with rivers from the CIA World
Database II, combined for a model of Europe in July 1993. Lake Bodensee
where Germany, Swiss and Austria meet. At the bottom you can see the foot-hills
of the alps.| To visualize all the good stuff from the net I have made an application for Windows 95 & NT. It's now available for free download Be warned though: You will need some of the data described later on this page before you can do anything with it, it's not exactly plug & play and there are always features that are only halfway implemented... Click here for current features. |
DEM and AVHRR data, along with rivers from the CIA World
Database II, combined for a model of Europe in July 1993. Lake Bodensee
where Germany, Swiss and Austria meet. At the bottom you can see the foot-hills
of the alps. |
Elevation data is split into several files per continent. Each consists of a raw image file where every word (16bit, big endian) represents an elevation, and several clear text header files (be sure to get them all). Resolution is at least 30 arc seconds or 1 km. The whole planet should need roughly 2 GB in this format.
The 30" DEM in managable sizes
Doug Fortune has preprocessed the 30" DEM into smaller images of 360x180 pixels up to 4320x3160 pixels for a complete earth. These come in handy if you want to do something on a global scale where the original 2GB are too unwieldy. There are also 8bit versions suitable for bumpmapping.
Similar(?) data in 1° squares. I haven't used these yet.
Digital elevation model of the continental US, Hawai and Alaska in 1° squares. Resolution is 3 arc seconds, that's an elevation value roughly every 100 m (!) Access via FTP, but index by states and through a clickable map.
ETOPO5
A DEM that has a resolution of 5 arc minutes only, that is at least 10km. Comes in handy because the size of the whole earth is only 11MB compressed. Also contains elevation for the oceans, as opposed to the 30" DEM.
Web interface to retrieve partial coverages
A
location where you can download the complete ETOPO5
A mask that indicates if there is water or land for "every" point on earth. The projection type is interrupted Goodes homolosine. The resolution is 30´´ or 1 km. Raw raster image data with 8 bit per point. 0 is water, 1 is land and 2 means the point lies in the interrupted area. The image size is 17347 lines by 40031 samples. You get the whole world in a 3.5 Mb zipped file, but beware! It unzips into a single 680 Mb file...
Map of the world in vector format. Prehistoric
predecessor to the "Digital Chart of the World" (DCW, see below), which
is now only commercially available on CDROM. This one is free but unchanged
since the 1980s.
It contains coastlines, rivers, islands and the like.
Also contains a file with "names of populated places". Seems that CIA thought northamerica is the only populated place on earth. Or is this a post-nuclear scenario?
(FTP)
The same at an alternate location
The CIA World Database in a special format. There is also C-sourcecode
to read and plot this format. (FTP)
DCW - Digital Chart of the World
Contains detailed layers of boundaries,
topography, hydrology, roads, everything. You can actually use this to
create working maps with global or national scope. Its in a proprietary
format and is sold on CDROM,
for money, so it doesn't belong here (it's a real bargain though).
But you can download ARC/Export shape files generated from it for free
here:
http://ortelius.maproom.psu.edu/dcw/
And you can download country boundaries as polygons in plain ASCII format here:
http://ortelius.maproom.psu.edu/cgi-bin/ian/points/index.cgi
 Sample image produced from the AVHRR 10-day composite.
It shows nicely what "interrupted Goodes homolosine map projection" really
is all about.
Sample image produced from the AVHRR 10-day composite.
It shows nicely what "interrupted Goodes homolosine map projection" really
is all about.
Processed satellite imagery that is organized in 10 bands. One of these is an infrared band, another a visible light band, different combinations of these two and so on. |
You can retrieve what ever portion
you need entering latitude/longitude boundaries in a HTML form.
The most interesting band is the one called NDVI, which effectively shows the extent of vegetation. Every dataset is the intermediated imagery of 10 days. The projection type is "interrupted Goodes homolosine projection" which has the advantage of roughly preserving the relative sizes of land masses. The disadvantage is that it isn't continuous, meaning there are areas in the rectangle that don't map to points on a sphere and are therefore "blank" (compare image). |
Something quite similar in Europe, but not so readily delivered.
Global Land Cover Characteristics Database
These images characterize each point on earth into categories like "scrub", "trees", "ice", etc. This might come in very handy to generate a "true" image of the earth. They have been processed "by hand" from the AVHRR data above. They are in Goodes homolosine projection also, each point is 1 byte, 17347 lines x 40031 samples (columns). The legend provided for each file shows which byte value corresponds to which vegetational feature.
Now, here is something useful: sample code in C that converts Goodes homolosine map projection to nice, manageable rectangular lat / lon coordinates:
ftp://edcftp.cr.usgs.gov/pub/software/misc/gihll2ls.c
Computers can do fancy map projections on-the-fly if you need one, thankyou.
It takes hours of processing to convert that Goodes gunk to something else.
That had to be said :o)

A view of my home in Feuerbach north of Stuttgart. At the right you can see river Neckar. Just left off the center is Feuerbach, where I live just beneath the vineyard. On the left, connected through a valley, is Weilimdorf. The image covers an area of ca. 8000 x 5000 m. |
This is roughly 0,001% of a series of LANDSAT images that cover all of Germany (the former Western Germany, to be exact) at an resolution of 25-30 m/pixel, and it's geocoded (fits latitude/longitude projection). It aren't really such nice pictures like this one showing my home, but rather 10 bands from microwave to ultraviolet. I have put up this "realistic" image using bands 1-3 and extensive imageprocessing. |
Satellite images of Japanese prefectural gouvernment sites

Tokyo Bay |
These Japanese are weird, aren't they ? Luckily, since "prefectural gouvernment sites" are likely to be situated in major cities, we get some pretty high resolution images of the latter. |

Sample |
Satellite image "strips" that yield very high resolution information. Available strips are scattered throughout the whole planet. They can be retrieved by date, name or through a clickable map of the world. |
| Check out the BADGER project. Orthophotographs and maps of the San Francisco area down to a resolution of 1 m/pixel (!)(!!!). Free download during the beta test phase. | 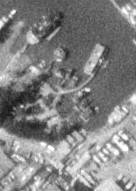 Someones house in Sausalito at 1 m/pixel. Note the Chihuahua
in the dogs kennel.
Someones house in Sausalito at 1 m/pixel. Note the Chihuahua
in the dogs kennel. |
Query form for global names-of-places (this is called a GNIS) with many options. The catch to it is that you can't simply download all the names, but get the result of your query served as a nice HTML document.
USGS Mapping Information: GNIS Data Base Query Form
Query form for places in the US - missing in the previous database.
You can grab the names and population of every place in the US. Separate zip-files by state.
(FTP)
Overwhelmed by that much data? For the WinGlobe toy above I preprocessed free data so that it comes with the app and the user doesn't have to worry about it. If you're interested in the data that is used there (like city names and position, time zones and DST information, a country list with lat/lon centroids, political country boundaries and a bitmap relief map of the earth in easy to use rectangular projection - contact me at dirk@djuga.net . I don't give away my processed data for free, but cheap, and you can get code samples.