 This page has been visited:
 This page has been visited:
 times since [02/28/98]
02-28-98
The guiding PARADIGM for all of the endeavors of SPRING SYSTEMS is embodied in MAPŠ, which stands for 'Multi-Attribute-Product MODEL'.
The graphical representation of this model looks as follows:
What this means, essentially falls into a number of sub-categoties:
o In a MATRIX, COLUMNS and ROWS are readily interchangable (TRANSPOSABLE) without altering their basic functionality.
o A MATRIX can be readily manipulated for analytic purposes (such as discovering OPPORTUNITY areas or calculating SHARES of IMAGE).
o By DEFAULT, the COLUMNS of the MATRIX represent ATTRIBUTES or CRITERIA (even though the GRAPHIC has it the other way around; otherwise the MAPŠ acronym would not work ) and the ROWS represent BRANDS or OBJECTS.
o Not all COLUMNS/ATTRIBUTES/CRITERIA are equally important, and because of this, an additional VECTOR of IMPORTANCE WEIGTHS is introduced.
o The DEPENDENT VARIABLE is expressed as a SHARE.
o SHARES are NON-LINEAR functions of weighted BRAND/OBJECT performance PERCEPTIONS.
o EMPIRICAL EVIDENCE over TIME and CATEGORIES has shown that SHARE of IMAGE
can PREDICT SHARE of PREFERENCE. In other words, properly measured ATTITUDES
can predict BEHAVIOR.
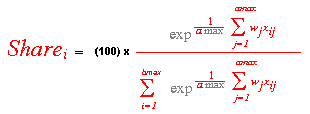
Another way to show the relationship between BRANDS/OBJECTS and CRITERIA/ATTRIBUTES can be represented by the following equation:

There are (i ... bmax) BRANDS or OBJECTS.
There are (j ... amax) ATTRIBUTES or CRITERIA.
There are (j ... amax) CRITERIA IMPORTANCE WEIGHTS.
Each Xij represents the RATING of the ith OBJECT on the jth CRITERION.
Each Wj represents the IMPORTANCE WEIGHT on the jth CRITERION.
What this means is that each of the (i) brands or objects on (j) criteria has a SHARE that is determined by:
o Doing better on IMPORTANT criteria counts for better OVERALL performance.
o The relationship of weighted criteria AVERAGES between OBJECTS or BRANDS is not LINEAR, so SHARES are computed based on an (exp) transformation.
Since SHARES have the desirable property of ranging from 0-100 (0-1.0 if divided by 100), they can also be interpreted as PROBABILITIES. This is in fact the proper interpretation if the MATRIX is for only ONE INDIVIDUAL.
What all of the preceding really says on an INDIVIDUAL LEVEL is our slogan:
"Consumers are more likely to purchase products/services that they perceive as meeting their most important needs better than competition."
The PRODUCTS are the OBJECTS, the NEEDS are the CRITERIA, and the SHARES are the PROBABILITY of being purchased/used for each BRAND/PRODUCT.
This PARADIGM (with appropriate modifications for each individual instance) covers a broad range of situations. It is used in AGGREGATE MARKET STRATEGY MODELING, as well as CONSUMER BRAND IMAGE/PERCEPTION MODELING, MEDIA EFFICIENCY MODELING, and NEW PRODUCT TRIAL MODELING.
For more details on computational issues:
SEE: MAP(c) COMPUTATIONS
The illustration which follows, shows how the MAPŠ PARADIGM is at the center of various acitivities that relate to INFORMATION GATHERING for the purpose of sharpening MARKETING MANAGEMENT.
This is essentially a blueprint for both RESEARCH and MARKETING MANAGEMENT. The fact that a broad spectrum of phenomena can be modeled by a MATRIX of OBJECTS and WEIGHTED CRITERIA, with a DEPENDENT SUMMARY MEASURE for each OBJECT that can be expressed as a SHARE/PROBABILITY, provides the opportunity to subsume a diverse set of activities under a common umbrella.
Our approach to using the MAPŠ PARADIGM to address opportunities/problems, falls into TWO distinct areas:
2) Develop SOLUTIONS and TEST THEM for their ability to capitalize on previously identified OPPORTUNITIES.
The MAPŠ modules that are primarily used to identify OPPORTUNITIES are: MARKET MAPPING, ATTRIBUTE MAPPING, and STRUCTURE MAPPING.
The modules that are used to EVALUATE how various PROPOSED SOLUTIONS do in terms of CAPITALIZING on OPPORTUNITIES are: SEMANTIC MAPPING and CONCEPT MAPPING.
If a NEW product is involved as part of the solution, TRIAL MAPPING is used to translate CONCEPT PERFORMANCE into TRIAL POTENTIAL.
HOW WE WORK WITH A CLIENT
When working with a client, we will first of all check whether the questions/issues addressed by each MAPŠ module have already been adequately covered by the client's own information base.
If the answer is 'YES', we'll incorporate what's available. If it's 'NO', we'll implement the appropriate MAPŠ module.
The order in which we examine opportunities/problems looks like this:
We will typically START with MARKET MAPPING ( see * MktSIM(c) Marketing Simulation Model ) in order to isolate OPPORTUNITY areas in the MARKETING MIX.
MARKETING MIX areas of OPPORTUNITY will most likely be discovered via running a number of different 'what if' scenarios, where different levels of MARKETING MIX inputs are systematically varied/manipulated.
More often than not, MARKETING OPPORTUNITIES require a closer look at CONSUMER/CUSTOMER opportunities. A first step in this area entails the discovery of CRITERIA/ATTRIBUTES that CONSUMERS/CUSTOMERS use in selecting one BRAND/PRODUCT/SERVICE over another.
A specially designed small-scale Qualitative/Quanatitative hybrid interviewing technique is used to elicit CRITERIA. The process involves a RIGHT/WRONG SEARCH, an IDEAL SEARCH, and finally a CRITERIA SEARCH.
The primary output is a qualitative feel for the category and a LIST of CRITERIA that can be used in subsequent research.
We will also use PERCEPTUAL MAPPING ( see * ARGUS(c) Perceptual Mapper ) in this phase of development to get a VISUAL perspective of what the consumer/customer view of the category looks like.
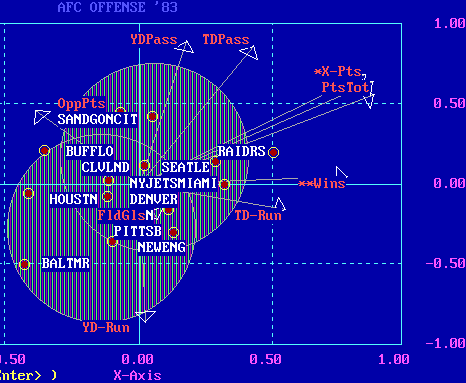
If the FULL ARGUS MAPPING system is used, the MAP which is produced will simultaneously show 1)OBJECTS [as dots], 2)VARIABLES [as arrow vectors], and 3)CLUSTERS [as shaded circles]. In this instance the MAPŠ paradigm and the representational MAP become one.

This is essentially the visual representation of a prototypical MAPŠ MATRIX. All of the complex multidimensional information contained in the MATRIX can be clearly seen on the relatively simple 2-D MAP.
STRUCTURE MAPPING is essentially a tool that's used to identify CONSUMER or CUSTOMER OPPORTUNITIES. Given that a list of CRITERIA has been obtained, STRUCTURE MAPPING is conducted with a LARGER, more REPRESENTATIVE sample.
We'll use one or more modules from our STATISTICAL SYSTEM ( see * TURBO Spring-Stat(c) Modular Stat Package ) to provide analytic resources for generating the findings.
STRUCTURE MAPPING provides the following information:
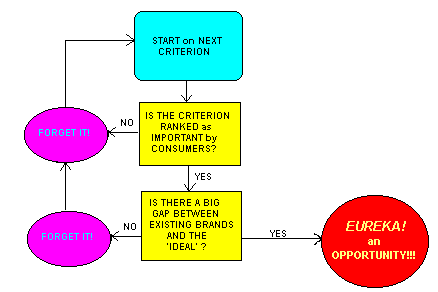
The MAIN output is OPPORTUNITY CRITERIA, and how they are selected looks as follows:

The OPPORTUNITY selection model can of course be modified to accomodate specific needs, but we've found it to be most effective 'AS IS' in a majority of cases.
For more details on computational issues:
SEE: MAP(c) COMPUTATIONS
Given that broad opportunity areas/positioning goals have been identified via STRUCTURE MAPPING, SEMANTIC MAPPING is done to determine how well a fairly large number of isolated PRODUCT CHARACTERISTICS or COPY POINTS imply GOOD PERFORMANCE on KEY CRITERIA.
SEMANTIC MAPPING is done with REPRESENTATIVE SAMPLES, and is designed to pinpoint which PRODUCT ATTRIBUTES and COPY POINTS do the best job of IMPLYING GOOD PERFORMANCE on OPPORTUNITY CRITERIA.
It's a technique that enlists consumers to establish a LINK between PRODUCT FEATURES and CONSUMER BENEFITS.
CONCEPT MAPPING assumes that the issues of: WHAT TO SAY; WHOM TO SAY IT TO; and HOW TO SAY IT have essentially been settled based on information available from the CLIENT or information derived from previous MAPŠ modules.
This method for testing CONCEPTS (which can be anything from PARAGRAPH descriptions of CONCEPTS or NEW PRODUCTS, to FINISHED TV COMMERCIALS or PRINT ADS) works as follows:

o Within each PANEL, the TEST DESIGN is a PRE/POST measurement of BRAND/OBJECT preferences and PERCEPTIONS in a COMPETITIVE environment.
o RESPONDENTS indicate their PRIOR preferences and attitudes, are then exposed to a TEST STIMULUS, and are then RE-MEASURED on the same preferences and attitudes. They are in effect THEIR OWN CONTROLS.
o POST shifts (DIFFERENCES) in PURCHASE PROPENSITY and PERCEPTIONS on key CRITERIA are compared across panels with different intervening STIMULI.
o The BOTTOM LINE is determined by how well each CONCEPT/STIMULUS performs in INCREASING PURCHASE PROPENSITY in a COMPETITIVE ENVIRONMENT. In other words, ranking takes place on the basis of which STIMULUS/CONCEPT does best in increasing SHARE (of both IMAGE and PURCHASE PROPENSITY).
o For DIAGNOSTIC PURPOSES we also check which STIMULI/CONCEPTS do the best job of altering PERCEPTIONS on key (OPPORTUNITY) CRITERIA.
This module of MAPŠ only comes into play if part of the CAPITALIZATION on OPPORTUNITIES involves the development of a NEW PRODUCT.
If in fact the CONCEPTS used in CONCEPT MAPPING represent NEW PRODUCTS, then TRIAL MAPPING will take the SHARE ESTIMATES coming from CONCEPT MAPPING (which assume PERFECT AWARENESS and DISTRIBUTION) and perform a SHARE forecast based on more REALISTIC assumptions of AWARENESS and DISTRIBUTION over TIME. Input to this MODEL also includes REPEAT rates, which are typically estimated on the basis of PRODUCT SATISFACTION TESTS.
We will use Trial/Repeat based simulation ( see * TrialMAP(c) Trial/Repeat New Product Simulation Model ) in this phase of development to get a range of scenarios which can provide clues for the new product's probability of success, given various marketing and marketing decision parameters, and its performance in CONCEPT MAPPING.
WHAT GOES AROUND COMES AROUND
Beyond this point, whether the CYCLE involves a NEW PRODUCT or an EXISTING PRODUCT, things start all over again. MARKET MAPPING with NEW data will in effect monitor how well the IMPLEMENTED MARKETING programs have done in terms of CAPITALIZING on both MARKET and CONSUMER OPPORTUNITIES.
How much will it cost? Consult our COST ESTIMATOR.

o Return to: 'SPRING SYSTEMS HOME PAGE'