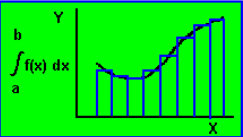
Calculus Lesson:
The area under a curve can be found
by adding the areas of an increasing
number of narrower rectangles - Riemann

11-07-97
The equation shown above, is of course the formula dearly beloved by statisticians. It depicts the CUMULATIVE NORMAL DISTRIBUTION. It is an integral function (i.e. it defines the area under a curve). How this works is illustrated below:
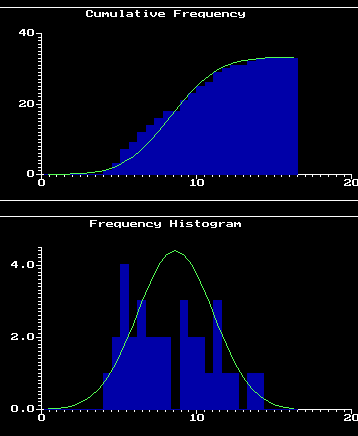
01-29-97
The 2 graphs which follow, illustrate BOTH the cumulative NORMAL curve and its FIRST DERIVATIVE, the famous BELL CURVE. In this case, the curves are overlaid on frequency data to give the viewer an idea of how closely the actual sample data approximate a NORMAL distribution.
Although the primary usage for this particular version of the S-CURVE, is statistical distributions, this family of curves (which also includes the LOGISTIC and the GOMPERTZ curves) has much broader applications.
The S-CURVE model of REWARD [y] vs. EFFORT [x] (of which the ad model is one example) works as follows:
In the lower ranges of x there is very little response on the y axis. This can be thought of as STARTING FRICTION.
Once the x variable reaches and goes beyond the first inflection point (which can be thought of as the THE PRICE of ENTRY), it enters a region known as the SWEET SPOT where effort x is directly proportional to reward y. This is the zone within the curve where effort is most productive.
Effort along the x axis will be proportionately rewarded until we hit the second inflection point. After we pass this point, we enter into the region of DIMINISHING RETURNS. After passing this point, each increase in x will yield progessively less incremental reward in y.
Checking this out against your own experiences of REWARD vs. EFFORT will probably show that this model makes sense. The trick is to fit it to a particular situation, and most importantly, to find the locations of the two INFLECTION POINTS.
Here we have a situation where EFFORT [x] is positively rewarded only until we hit the PEAK or HUMP. Once x passes beyond this point ( OVER THE HUMP ), the RESPONSE [y] is actually NEGATIVE (i.e. it decreases). This is because we are now measuring MARGINAL REWARD on [y] rather than ACTUAL REWARD. The model shown here is similar but more refined (since it has inflection points at the tails) than the QUADRATIC UTILITY MODEL (see DIMINISHING RETURNS ).
04-20-07
We also have a NON-LINEAR CURVE FITTING MODULE (i.e. MODULE #20. MARQUARDT NON-LINEAR FIT ) in our Spring-Stat(c) system which you might use in order to fit an S-CURVE to a set of X,Y data points.
Finally, if you wnat to 'roll uour own' regarding any of the issues in this post, you may want to go to our ARRAY PROCESSING RESOURCES link and see what tools are available.

o Return to: 'SPRING SYSTEMS HOME PAGE'