![]()
![]()
![]()
![]()
|
|
|
|
![]()
GRAPHICAL PRESENTATION OF THE OBTAINED RESULTS
During the analysis of each point the most important results are simultaneously presented symbolically and graphically (Figure 1) In the left upper corner a figure divided into two parts is presented. The left part of the figure displays the stratography and settlements of the point under consideration, and on the right part of the same picture the vertical stresses distribution is presented with the location and the value of maximum stress is indicated. In the right upper corner the deformations of all underlying layers of considered computational point appear on the screen during the calculation. Their sum representing the complete settlements of the point is also displayed. All these results are automatically stored also in the output file. The figures are not stored automatically but optionally. In the bottom part of the screen all bases and the computational points are presented in the plan view.

Figure 1: Typical screen during an analysis
When analysing stresses and settlements it is often required to study their behaviour not only in selected predefined points but also either in given planes or given regions. The package thus offers menus that allow a comparison of all the results in various forms of graphical representation. Probably the most effective one is a three-dimensional representation of the results over a selected rectangular area (Figure 2, top row).Three-dimensional representation offers a complete information about the distribution of the results with the implementation of view angle change. With the change of the scale for plots the optimal graphical representation can be obtained. In this way stresses and settlements can be represented.
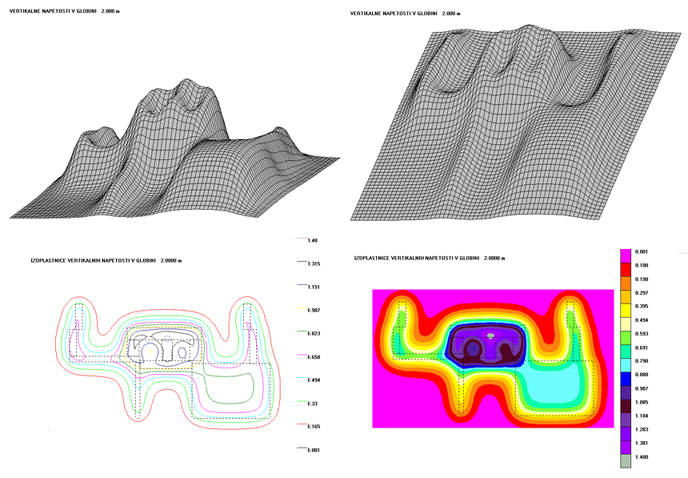
Figure 2: Distribution of stresses in a selected depth for a defined rectangular area (different representation options)
3D representations of the results can be also replaced by representation with isolines (Figure 2, bottom row left) or isosurfaces (Figure 2, bottom row right).The advantage of such representations over 3D representation is always presented clear distribution of the results without further modifications of the figures. Another essential advantage of such a representation is that it is possible to select additional single points for verification of stresses and settlements directly from the figure using mouse only. Although such additional points can also be selected manually the implementation of the mouse allows more user friendly selection of desired points.
|
