Copyright (c) B.Achutha 1992 - 2000 Malaysia

Crash of 1997
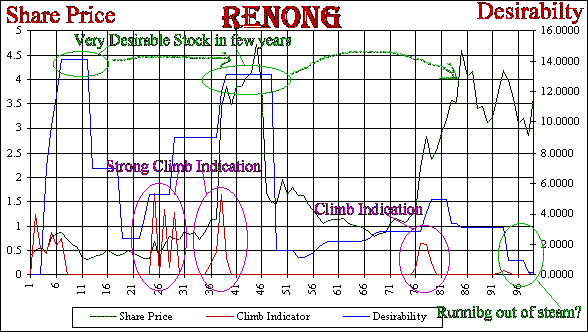
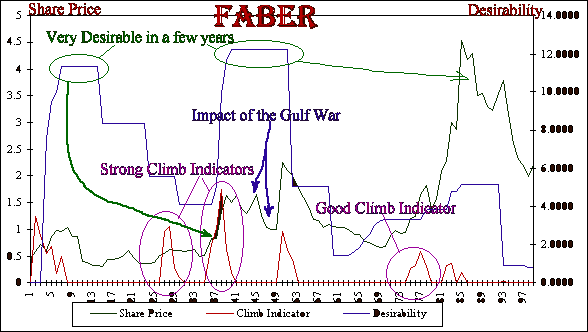
Here is the other graph that was sent out to several companies in March 1997.

Observe how the Desirability function had dropped to a very low value by month 51 and does not recover. The time axis (x-axis) is marked out in the number of months form January 1987. The graph is for January 1987 to 1995. There are several other functions (equations) used to analysis a share price movement but I won't go into them here.
The graph below was not published.

.