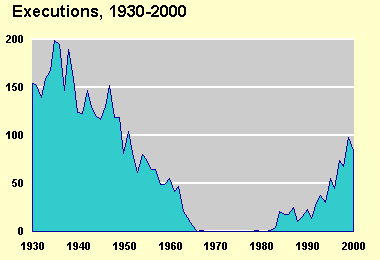
For all you visual learners out there, we included these statistics to give you a better idea of how the rates of execution have increased or decreased over time.
| Executions,
1930- 2000
At yearend 2000, 37 States and the Federal prison system held 3,593 prisoners under sentence of death, 1.5% more than at yearend 1999. All had committed murder. In 2000, 85
persons in 14 States were executed
Of persons
executed in 2000:
Of those executed
in 2000:
Eighty of the
executions in 2000 were carried out by
Thirty-eight
States and the Federal government in
|
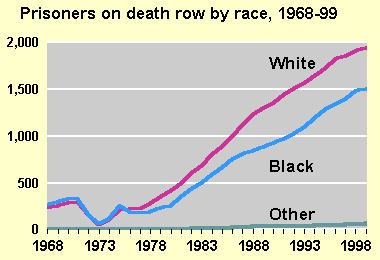
Prisoners
on death row by race, 1968-2000
Since the death penalty was reinstated by the Supreme Court in 1976, white inmates have made up the majority of those under sentence of death. Of persons
under sentence of death in 2000:
The 339 Hispanic
inmates under sentence of death accounted for 11% of inmates with a known
ethnicity.
All information courtesy of |
Some other facts from yearend 2000:
-- The number of prisoners on death roww has been increasing
-- Fifty-four women were under a sentennce of death.
Among inmates
under sentence of death and with available criminal histories:
-- nearly 2 in 3 had a prior felony connviction
-- about 1 in 12 had a prior homicide cconviction.
Among persons for whom arrest information was available, the average age at time of arrest was 28; 2% of inmates were age 17 or younger.
At yearend,
the youngest inmate under sentence of death was 18; the oldest was 85.