Collecting Data
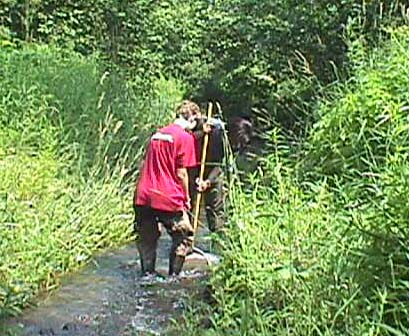
At each testing site, we collect three samples, using Hilsenhoff's kick-net method. One group member holds the net about a foot downstream from where the other member is standing, and will "kick" the bottom of the stream for three minutes, causing all of the aquatic macroinvertebrates to go into the net. Also, any rocks at the kick site are scraped by hand to dislodge any macroinvertebrates that may be living there. The first sample is taken at the farthest point downstream, the second sample is taken after this in the middle, and finally the third sample is taken at the furthest point upstream.
| Shawn kicks as Majiedah holds the net (7-2: Seeley Creek #3)
| After the samples have been collected, the group heads ashore to place each macroinvertebrate into a jar of ethanol to be preserved. One or both of the members will do this for a time of thirty minutes, established especially for this project. | 
| | Tammie, Becca, Shawn, and Majiedah preserve the macroinvertebrates (7-16: Pan Hollow)
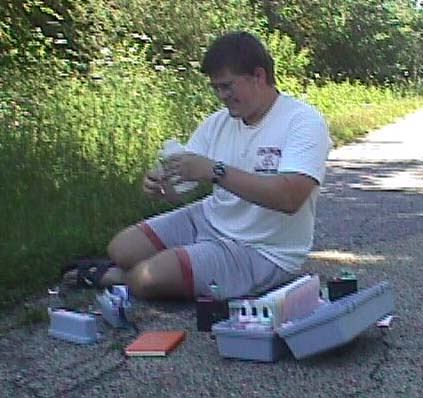 While the preserving is going on, I run three chemical tests on the creek: Dissolved Oxygen, Nitrate, and pH, using the special kits.
I conduct a chemical test (7-16: Pan Hollow)
After the chemical tests, a member of the group will run the turbidity test. The member enters the creek, then walks upstream and fills a bottle with water. With a nylon over the top of the turbidity tube, the member pours the sample into the tube. When it is full, the member looks at the tube from the top, until they are able to see the sechi disk at the bottom. The member notes the reading on the side of the tube. 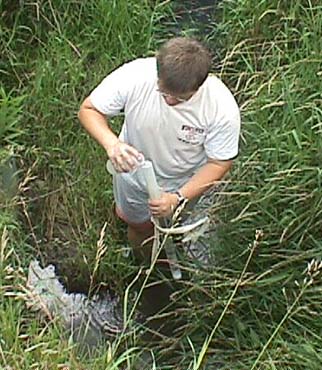
| | I test the turbidity of the creek (7-16: Misty Valley Creek)
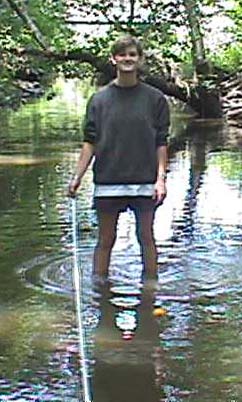 Next, two members of the group find a straight portion of the stream to run the velocity test, using our high-tech "orange method." The members measure ten meters (or five if there isn't a stretch ten meters long) between them. The member standing upstream drops the orange and times how long it takes for the orange to travel the distance. This is repeated three times, and the average is taken. The time over the distance produces the velocity.
| Shawn watches as the orange travels (7-23: Provorse Hollow)
| | | | | | | | | | | | |
Identifying Macroinvertebrates (Lab Work!)
 Bird's Eye View of the Randomizing Bin (7-15: Honey Creek, Hemlock Draw ID) Bird's Eye View of the Randomizing Bin (7-15: Honey Creek, Hemlock Draw ID)
Each jar (one per sample; three per stream) is emptied into a bin that is divided into twelve equal squares. The macroinvertebrates are equally spaced. The member chooses a slip of paper to determine which square to select first. Each macroinvertebrate in that square is moved to a petri dish which houses the new subsample, to be identified. This process repeats until one hundred macroinvertebrates have been selected or when the bin is empty. (The square that breaks 100 is completely emptied before this process ends)
| Becca selects 100 macroinvertebrates to ID randomly (7-15: Honey Creek, Hemlock Draw ID)
After the subsample has been completed, the task of identifying the macroinvertebrates begins. Using a series of charts, each member identifies their subsamples to the order level. Each order is stored in seperate containers. 
| | Shawn looks through a microscope to identify her subsample (7-7: Seeley Creek #3 ID)
 When the entire subsample has been identified, each order is placed into a jar with ethanol to be preserved for further examination.
| | The results of one subsample of Seeley Creek #3
| | | | | | |