
|
Home Index |
|
Home Index |
|
Contact: email daveclarkecb@yahoo.com Also see Evaporation barriers, Eyre Peninsula water supply, the proposed Spencer Gulf desalination plant, SA government and Sustainable electricity. |
|
|
|
|
One very valid objection to desalination has been its substantial energy requirement and the fact that our use of fossil fuels is causing climate change. In fact plenty of sustainable energy would be available from the 2000MW of proposed SA wind farms if our federal government would change its policy from supporting fossil fuels to supporting renewable energy and if our state government was to match its fine words with action; there is so much more that could be done. As things stand, most of these wind farms will not be built.
Chemicals used in the water pretreatment and in the reverse osmosis process itself can also be problematic when they are released, with the brine stream, back into the sea. Coaguants like ferric- or aluminium-chloride are used to improve the initial filtration process and both alkaline and acidic solutions can be used in the RO plants to remove silt deposits, biofilms, metal oxides and scales. (However, I believe that reverse-osmosis seawater desalination plants can be operated without such undesirable chemicals, or at least without releasing them into the waste stream.) More can be read on the Clean Ocean Internet site, the full URL for what is probably the most relevant page is http://www.cleanocean.org/index_general.asp?menuid=040.090.010.
If our governments were to think the expense worth-while they could also reclaim much of the waste water and storm water that at present pollutes St Vincent Gulf. And, if the development money was available, a lot more sustainable energy could also be generated from hot dry rocks.
|
Home Top Index |
| ||||||||
|
Bureau of Meteorology (While the map is the total rainfall for the week ending 2008/12/14, most of the falls in the SE corner were in the 72 hours to 9am on the 14th.) | ||||||||
|
Putting this in perspective:
How much of the 72TL will go into the reservoirs or flow down the Murray? I'd be surprised if it was as much as 1%. By far the greatest part will be absorbed by the very dry soil and will either transpire or evaporate over the next few months. Where I live, Crystal Brook, there was 76mm of rain; there was runoff from the town area, but none from broad acres; the Crystal Brook did not flow. There would be runoff from areas with exposed rock or shallow stoney soils, but the Crystal Brook experience (there are some area of shallow, stoney soils upstream of the town) suggests that even these will not produce much flow.
Summer rainfalls, while they do great good for the remnant native vegetation, are all but useless so far as the flow and storages in the Murray-Darling basin is concerned. Climate change seems to be increasing summer rainfall and decreasing rainfalls at those times of the year when they might produce more run-off.
|
Home Top Index |

|
|
Australian mean annual temperatures - credit: Aust. Bureau of Meteorology, 2008 |
Temperatures are rising, not only over the Murray-Darling basin, but over Australia generally, including the reservoir catchment areas in the Adelaide Hills (see the graph at right). Higher temperatures mean less runoff because the transpiration needs of the plants in the catchments increase steeply with the higher temperatures. Every additional litre that plants take up is one less litre to run into a water supply reseroir.
Trees, in particular Australian native trees, are very good at taking up whatever moisture exists in the deep subsoil during the warmer half of the year, when they do most of their growing. The water that trees use in summer is usually replenished in the cooler, wetter half of the year. Generally, there is little run-off until the soil and subsoil becomes waterlogged, and this only happens after the moisture deficite from the summer has been made up by the winter rains. If the moisture deficite is larger due to greater summer water demands from higher temperatures, then it requires more winter rain to 'fill' the soil to the point where water will run off.
People are rightly being encouraged to plant more trees and native vegetation as a means of taking up some of the excess carbon dioxide from the atmosphere. Unfortunately, the more trees and bush, the less runoff.
|
Home Top Index |
|
The South Australian government should have been aware for a number of years
that our water supplies were declining, and that this was a permanent
condition, not a once-off temporary aberration.
The Olsen government partly sold-off and partly corporatised SA Water (once the Engineer and Water Supply Department), the organisation responsible for South Australia's water supply, but apparently did not stipulate any conditions for SA Water to provide sufficient water for the state's needs. There is a continuing policy of one price for most household and commercial water consumers, regardless of the cost of delivering water to them. (The cost of delivering water to Ceduna, for example, would be much greater than delivering it to suburban Adelaide. The fact that SA Water can only charge about $0.90/kL in Ceduna makes sea water desalination in far west SA economically unviable.) Surely if finding alternative sources of water are going to increase costs, then the price of water should reflect this. No-one wants to pay more than he has to, but the price of water should reflect its value and its cost. The Rann government has a target of increasing Adelaide's population to two million, they see the advantages of greater revenew, but are apparently unable to grasp the fact that much more infrastructure, roads, services and water will be needed to provide for these people. Also, the extra people will need jobs, and to have more jobs we must have more water. There is a dire need for increasing and diversifying SA's water supplies, but this has been ignored by several governments. Water restrictions are excusable for short, special emergency situations. Continuing restrictions, as we have had from 2007 to 2009, are an indication of poor government planning. |
|
Home Top Index |
|
|
|
"The agriculture industry was the largest consumer of water in 2004-05, accounting for 1 020GL or 75% of South Australia's water consumption. Livestock, pasture, grains and other agriculture had the highest water consumption within the agriculture industry with 483GL (or 47%) followed by Grapes with 204GL (or 20%). Households were also large consumers of water with 144GL or 11% of South Australia's water consumption."The full URL to this ABS page is given in the links section, below.
Water restrictions
The restrictions mainly limit how people water their gardens. There are no restrictions on how much water can be used for showering, bathing, washing clothes, etc. and, most significantly, there is no restriction on the total amount of water that can be used. We are not allowed to use sprinklers and are only allowed to hand water and/or use trickle-on irrigation for a total of three hours per week. There is no limit to the number of drippers or emitters in the trickle-on irrigation systems. The reason the restrictions will fail is that gradually people will increase the amount of trickle-on irrigation they have installed, as they 'improve' their watering systems. They will add a dripper here and a dripper there, and add a branch line here and there, and water consumption will rise. Everyone in South Australia who is on mains water has a water meter. One wonders where the problem is in allocating a set amount of water for each householder each year, depending of availability, and enforcing it with a system such as a fee of three or five times the standard water charge for water used above the allocation. Restrictions or market pricing?I suspect that it would be better to remove restrictions - after reserving appropriate flows for environmental purposes - all together and allow the market to decide the price of water based on supply and demand. It would be necessary to take away from SA Water the right to set the price of water; they would have to be limited to charging only for the costs of delivery of water; including maintenance of the pipelines. Someone would need to be appointed to negotiate to buy water licenses for the water required in the SA Water reticulation system, on behalf of all the consumers in that system.SA Water should also be made to charge reasonable rates based on the real costs of delivering water to each place; plainly the costs would be higher at some remote place such as Ceduna, compared to Adelaide. This would make water supply by third party operators viable; for example, it would probably become profitable for a private company to set up a sea-water desalinator at Ceduna. If the cost of water to low-income people such as pensioners became too high then it would make more sense to give relief in the form of supliments to the pensions rather than subsidise the price of water. |
|
Home Top Index |
Disadvantages of
desalination
|

|
Photo - credit Mick Hines |
|
From the ABS annual water consumption data,
above,
annual water consumption in all SA households is 144GL.
I suggest that this is the order of the capacity that we should be
considering.
(The desalination plant proposed for Adelaide
is 50GL/year.)
A single, big, desalination plant would have several problems.
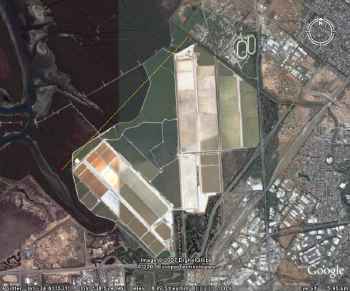
On the other hand, several smaller desalination units would have fewer problems. I'd suggest that about four desalination plants could be built along the Adelaide coast and others at or near Sellicks Beach (near the open sea so brine disposal would be easier, close to the water main from the Myponga reservoir, and far enough from Adelaide so that land prices would not be exorbitant), Victor Harbor, Price, Whyalla, Port Lincoln, and Ceduna. Each of these could produce about 144/10=14GL/year and would require a pipe of about a half-metre diameter to carry away the water it produced. Obviously the smaller fresh water flows would be much easier to incorporate into existing water mains within reasonable distances. They could be built as required, and more quickly than a single, huge, plant. Careful consideration would have to be given to the environmentally responsible disposal of brine. There are salt pans at Dry Creek (on the northern side of Adelaide) and at Port Clinton (northern Saint Vincent Gulf); if brine were disposed of in these then it would assist in salt production. I have written elsewhere on the risks of disposing of brine in northern Spencer Gulf. |
|
Home Top Index |
|
Wouldn't several smaller plants, perhaps one at Dry Creek and one at Port Stanvac, of smaller capacities make more sense? They could be built more quickly, distributing the water into existing mains would be simpler, and disposal of brine could be done with less environmental problems.
Other desalination plants could be built around the coast if required in the future, see How big and where?.
Since the original writing of this page it has been announced that the Dry Creek salt works will be closed and the land subdivided.
The area of the Price salt pans seems to be about the same as those at Dry Creek. Price would have slightly higher temperatures and slightly more sunshine than Dry Creek so a slightly larger amount of brine could be disposed of there.
|
Home Top Index |
|
Yorke Peninsula Council
reported that the new sea water desalination plant at
Marion Bay is producing 48kL of potable water per day.
(48kL/day is 17.5ML/year.)
It has a maximum capacity of 65kL/day (24ML/yr),
but at present this is not required.
The project cost was $500 000, which was mainly Council funds, with
little coming from the State Government.
Feed water is drawn from a 'beach well' dug 15m in the sand dunes.
Power for the plant is supplied by ETSA and its connection
cost the Council $72 000.
As of September 2007 the salinity of the return water (that which goes back into the sea) is increased by 10%. The plant is expected to cost $20 000 to $30 000 per year. The first stage testing indicates that the power cost works out at $1.53 per kilolitre of water. I'd like to thank Mick Cartwright of the District Council of Yorke Peninsula for the information in the last paragraph; the remainder came from the Council's Internet news page. |
|
With modern reverse osmosis desalination no more than 6
megawatt hours (MWh)
of electricity is needed to desalinate one megalitre of water.
See
desalination data from Internet, below.
A single 2MW wind turbine, working at a capacity factor of 35%, can provide sufficient electrical power to desalinate 1000ML of sea water each year. 2MW is a typical rated output of the commercial wind turbines being built in SA in 2007. How many turbines would you need if you used wind power to run the desalination?From the ABS annual water consumption data, above, annual water consumption in all SA households is 144GL. This amount could be desalinated from sea water using the power from around 150 two-megawatt turbines.
By way of example, the Hallett wind farm at present under construction will have forty-five 2.1MW turbines. Given the 35% capacity factor mentioned above each turbine in the Hallett wind farm would be expected to generate 2.1 x 0.35 x 24 x 365 = 6440MWh per year. Since there are to be 45 turbines, 6440MWh x 45 = 290 000MWh (290GWh) would be generated by the entire wind farm. At 6MWh/ML, if all the electricity generated by the Hallett wind farm was used for desalination, it would produce 50GL (290 / 6 = 50 approx.) of fresh water each year. That is, if the power from the Hallett wind farm was to be used to desalinate sea water by reverse osmosis, it could produce about a third of the water consumption of all households in South Australia. Pipe flowFor the calculation of the needed pipe sizes I have used an altered form of the Hazen & Williams equation:H=3.022xLxV^1.852/(C^1.852xD^1.167) H- Head loss in metres L- Length in metres V- Velocity in metres per second D- Diameter in metres C- Dependent on smoothness of pipe. For smooth pipe C=150, for 50 yr old cast iron C=90. |

|
|
|
|
Home Top Index |
Units and technical termsCapacity factorThe wind does not blow all the time, and when there is a light wind, wind farms produce less than their maximum electricity output. The capacity factor for a particular wind farm is the percentage of the rated capacity that is actually generated over a long period of time. The typical capacity factor of a SA wind farm of 35% indicates that for each 10MW of installed capacity, on average around 3.5MW will be generated.kL, ML, GL, tonne, m3A kilolitre (kL) of water is 1000 litres, equals one cubic metre (m3) and weighs one tonne.A megalitre (ML) is 1000kL, a gigalitre (GL) is 1000ML. kW, MW, MWh, GWhA kilowatt (kW) is 1000 Watts (W); it is a unit of power.A kilowatt-hour is the equivalent of one kW being used for one hour; it is a unit of energy. A megawatt-hour (MWh) is 1000kWh, a gigawatt-hour (GWh) is 1000MWh. |
Wave-powered desalinationA wave-power system designed by CETO can either generate electricity (Aus$80/MWh claimed) or desalinate sea water at a claimed cost of around Aus$1.50 to $2/kL. |
|
An article on a desalination plant in the Israeli city of Ashkelon,
reported on the
European Jewish Press,
gives the cost as (US$?) $0.53/kL.
An article on Marketplace states that the new 136ML/day Singapore-Tuas seawater desalination plant disigned by Black & Veatch produces fresh water at (US$?)$0.49/kL. Economies of scale apply to desalination plants, but information I have received indicates that economies of scale flatten out for reverse osmosis plants of about 6GL/yr or larger. Cost of wind-powered desalinationKwinana, Perth, 2006The cost of water from the new Kwinana (near Perth in WA) desalination plant is estimated to be $1.17/kL. This plant is powered by wind-generated electricity. The capital cost of building the 45GL/year plant was around Aus$400M.In South Australia SA Water sells water to households for around $0.90 per kL (2007). |

|
|
|
|
Home Top Index |
Israel, ?2004From http://www.israel-mfa.gov.il/mfa/go.asp?MFAH0apv0. INVESTMENTS COSTS for medium to large plants are of the order of 500 to 1000 US$/m3/dayTYPICAL COSTS OF DESALTED WATER
|
Kwinana, Perth 2006In a pdf document available on the Internet giving an overview of the proposed Perth desalination unit by the WA Water Corporation...The desalination plant was expected to produce 45GL of fresh water from sea water each year and its power consumption was expected to be 24MW. This works out at 4.7 megawatt hours of electricity consumed per megalitre of water produced (MWh/ML). (24MW x 24 x 365 = 210GWh/yr; 210GWh for 45GL = 4.7GWh/GL [or 4.7MWh/ML or 4.7kWh/kL]).
Also in this document,
under "Major International Desalination Examples, Point Lisas - Trinidad"
is noted "Power Consumption 3.6 to 4.0 kWh/kL"
California, ?2004Electrical consumption figures from Californian Coastal Commission for the desalination of seawater.(I converted the US figures to metric and calculated the cost figures. Note that these costs are for electricity only, other heat is required for MSF and MED.)
Cost is based on Aust$0.07/kWh and includes only electrical consumption, does not consider capital or maintenance costs.
Note:
For MSF and MED additional thermal energy is required;
for MSF, about 21kWh/kL;
for MED, about 18kWh/kL.
I gather that Aust$60-70/MWh (Aust$0.06-0.07/kWh) is a typical wholesale price for green electricity (about Aust$30-40/MWh for fossil fuel electricity). The differential is connected to a 'Renewable Energy Certificate' which is currently about Aust$30/MWh. Information from Pacific Hydro |

|
|
|
LinksWater supply linksThe Atlas of South Australia has information of water supply. The full URL is "http://www.atlas.sa.gov.au/go/resources/ atlas-of-south-australia-1986/environment-resources/water-supply".The Australian Bureau of Statistics has an informative article, "4610.0 - Water Account, Australia, 2004-05" at the full URL of "http://www.abs.gov.au/AUSSTATS/abs@.nsf/ProductsbyReleaseDate/ 9F319397D7A98DB9CA256F4D007095D7?OpenDocument"
Green electricity linksFor questions regarding the renewable energy rebate etc. Office of the Renewable Energy RegulatorNational Electricity Market Management Co. Ltd. NEMCO. NEMCO average price tables were available at this site. An instructive site on the ins and outs of wind generated electricity by the Danish Wind Industry Association (link no longer functioning; you may be able to find it using a search engine).
Australian Wind Energy Association Has some interesting stats: General electricity generation linksBeyond Logic An oddly named, but very informative page on electricity generation in SA.Desalination linksSustainability and Economics in Agriculture: The Economics of Desalination and its Potential Application in Australia. SEA
Water Desalination International
;
Inquired by email 21st June 2003. Unit for ~8GL/year?
Lifestream Watersystems Inc.; Inquired by email 21st June 2003. HOH Canarias S.A. advertise "Desalination of sea-water for less than 3kWh/m3 ". Apparently RO. Calculations on their spreadsheet indicate Aust$0.77/kL, capital cost of Aust$1.17M for a plant that produces 328ML/yr. (These have been the most informative people so far. Aust$1=0.57 Euros.) Freddy Ludvigsen, vandmand@post7.tele.dk
Asian and Pacific Centre for Transfer of Technology (link no longer
functioning); |
|
Home Top Index |
Murray Basin water figuresThe Australian Bureau of Statistics had an informative page on irrigation extraction in Australia (link no longer functioning). This gave 10 232 GL as the total water diversion from the Murray-Darling Basin for irrigation and an additional 452 GL for domestic, industrial, stock and town use.Link to the Murray-Darling Basin Commission, MDBC. From The Australian Academy of Technological Sciences and Engineering (link no longer functioning); Of the total annually utilised (Murray Basin) flow of 13 000 GL, usage in the states is:
For comparison, annual consumption on Eyre Peninsula is about 9GL and for the whole of South Australia (from all sources?) 1 383GL; see SA Water consumption, above. From Grains Research and Development Corporation. Gross margin in $ per ML:
From The Age. "The rice industry uses 7% of our water to generate 0.02% of our GDP". |
|
Home Top Index |
IndexOn this page...Calculations Cost of desalination Cost of wind-powered desalination Desalination data from Internet Desalination power consumption Disadvantages of desalination Economies of scale? Explanation of units How big and where? How many turbines? Introduction Links Marion Bay desalination Port Hughes golf course Murray Basin water figures A summer rainfall event Poor water management Restrictions or market pricing? Runoff will be less in future SA Water consumption The proposed desalination plants Top Water restrictions Water restrictions for some Wave-powered desalination Why build at Dry Creek? |

 Work under way in this area