Technical Analysis to Day Trade Currencies
The day trading seminars and training sessions I have given in the past involved the use of technical analysis to determine when to buy and sell a given currency. Currencies can be studied using technical analysis just like stocks.
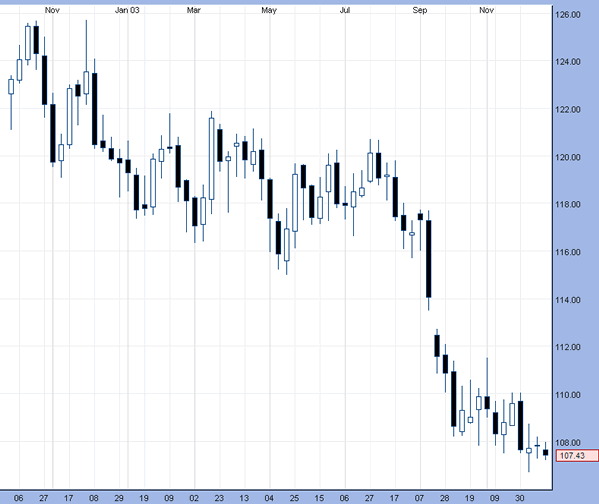
When a stock day trader with no knowledge of the currency market looks at at a chart of the US Dollar versus the Japanese Yen, he might actually think that he is looking at the price of a stock. "Is this the chart of IBM?," he might ask himself. This is because a currency looks the same on a chart than a stock. Look at the charting example below of the USD/JPY (each bar represents one week of prices):
The candlestick chart above represents about 1 year of exchange rate data. It shows the dollar getting weaker against the yen throughout the entire period in question. Many times if you look at a a year's worth of data for any currency, it will establish the same steady trend in one direction (look at the above example). This is because some fundamental factors that affect the prices of currencies can be in effect for months or years. Thus, foreign currencies tend to trend better than stocks and the trends typically last longer. This is also true for intermediate trends that exist within the longer-term trend. This is a characteristic that many who plan to take up currency day trading like.
Many traders [including myself] feel that currencies tend to respond better to technical analysis than stocks and the moves tend to be more continuous. Part of the reason for this is that since the forex market is more liquid [based on many estimates] than the stock market, currencies are a lot more difficult to manipulate. In the stock market, it is easy for a day trader to be forced to exit a position by a buyer or seller of size, even if the day trader entered the position according to logical technical reasons based on his trading system. This becomes obvious if we look at an example. The most liquid stocks like Microsoft (MSFT) or the QQQ's (NASDAQ-100 Index Trust) trade from 50 to 100 million shares a day. This is about 1.3 to 3.5 Billion dollars in value. In comparison, the daily volume of the forex market is in the trillions of dollars a day range, divided mainly among the top four or five major currencies. It is thus a lot easier to manipulate the price of MSFT at any given point of the day than it is to move the EUR/USD. When we go to a typical (but popular stock) like GE (between 10 and 20 million shares a day) or McDonald's (between 2 and 5 million shares a day), manipulation becomes even easier.
Remember the horror stories from 2000 to 2003 of the corrupt Wall Street analysts touting the stocks that their firms were selling? Now imagine the same scenario with currencies. What would the price chart of the euro have done if the same Wall Street analysts recommended that their clients buy euros when they were selling? Even if this fiasco would have been brought to light, NOTHING! The euro would have shrugged off the whole thing.
The use of technical analysis to day trade currencies will be covered by Trader Abel during his new series of FX training webinars.
What others are saying:
AWESOME SITE! I cannot tell you how much your site has helped me with my
trading. And I'm glad I found you right about when I first started...I
have done very well so far and large part of that success is due
to your suggestions... Dean P. Read More...
No testimonial used on this website is indicative of future results. Past results are not indicative of future results. The individuals quoted in the testimonials used were not paid to be quoted. The testimonials used on this website are unsolicited and are non-representative of all visitors.


