pi(x) vs "Prime Probability"
(Creation date February 8, 2004)
(Copyright Didier van der Straten 2004, 2005)
As an introductory chapter to a further study as per my page "sumaspi" I propose to revisit an already ancient attempt to predict pi(x) using a concept of "Prime Probability" that I often also call "Prime Density" concept derived from the Eratosthene's sieve.
One can consider the sequence of natural number as several "subsequences" each of which, as far as its "prime density", gets affected differently by the prime numbers situated in the previous sequences.
To be more precise, let us illustrate this with an example :
Between 25 and 49 (25 excluded and 49 included), there are 24 numbers, of which 6 are not multiple of 2, 3 and 5, which roughly suggests a "prime density" or "prime probability" of 0.25 as well as a "mean prime gap" of 4, the reciprocal of that prime density.
Using the Erathostene's sieve method, we might have crossed out the composite numbers multiple of 2, 3 and 5 (some numbers might have been hit more than once) and would have found 6 remaining numbers 29, 31, 37, 41, 43 and 49. Of these, 49 is obviously not prime, but is counted as such for the purpose of this approach.
Our "theoretical prime density" is therefore :
(1 - (1/2)) (1 - (1/3)) (1 - (1/5) = 0.26666...
which already differs slightly from the rough value computed above.
What this theoretical density actually enables to "count" is the quantity of numbers which are truly prime together with those whose the smallest prime factor is greater than 5.
The interval where this value is "valid" is from 5 (excluded) to infinite. Therefore it indeed predicts the quantity of prime numbers between 25 (excluded) and 49, making an error for this very last one.
The density of qualifying numbers beyond 49, up to 121, is affected by the next prime, 7, in an analog manner.
With this way of doing we might consider the overlapping intervals :
1 - 4
2 - 9
3 - 25
5 - 49
7 - 121
etc.
where we could compute a theoretical prime count based on a theoretical prime density. But we would produce a trivial error in each area of overlap where we would affect that interval with prime numbers which would systematically cross out composite numbers which were already crossed out by a smaller prime.
Hence it is suggested to focus at the subsequences as introduced earlier :
1 - 4
4 - 9
9 - 25
25 - 49
49 - 121
etc.
with the initial convention that the first number is excluded and the second number is included in the said interval.
From there, we might now attempt to formulate a predictive or "asymptotic" pi(x) for each interval :
x api(x)
1 - 4 -1 + x
4 - 9 0 + x * (1 - (1/2))
9 - 25 1 + x * (1 - (1/2)) * (1 - (1/3))
25 - 49 2 + x * (1 - (1/2)) * (1 - (1/3)) * (1 - (1/5))
etc.
The constant values -1, 0, 1, 2, etc. appearing respectively in each subsequence are not the result of trial and error attempts to prediction : they result from an intuitive idea that in the Eratosthene's sieve, we must subtract 1 in all subsequences to discount the number 1 whhich is not prime, and we must add respectively 0, 1, 2, 3, etc to reinclude the prime numbers 2; 2, 3; 2, 3, 5; etc; The theory behind this adjustment will be revisited.
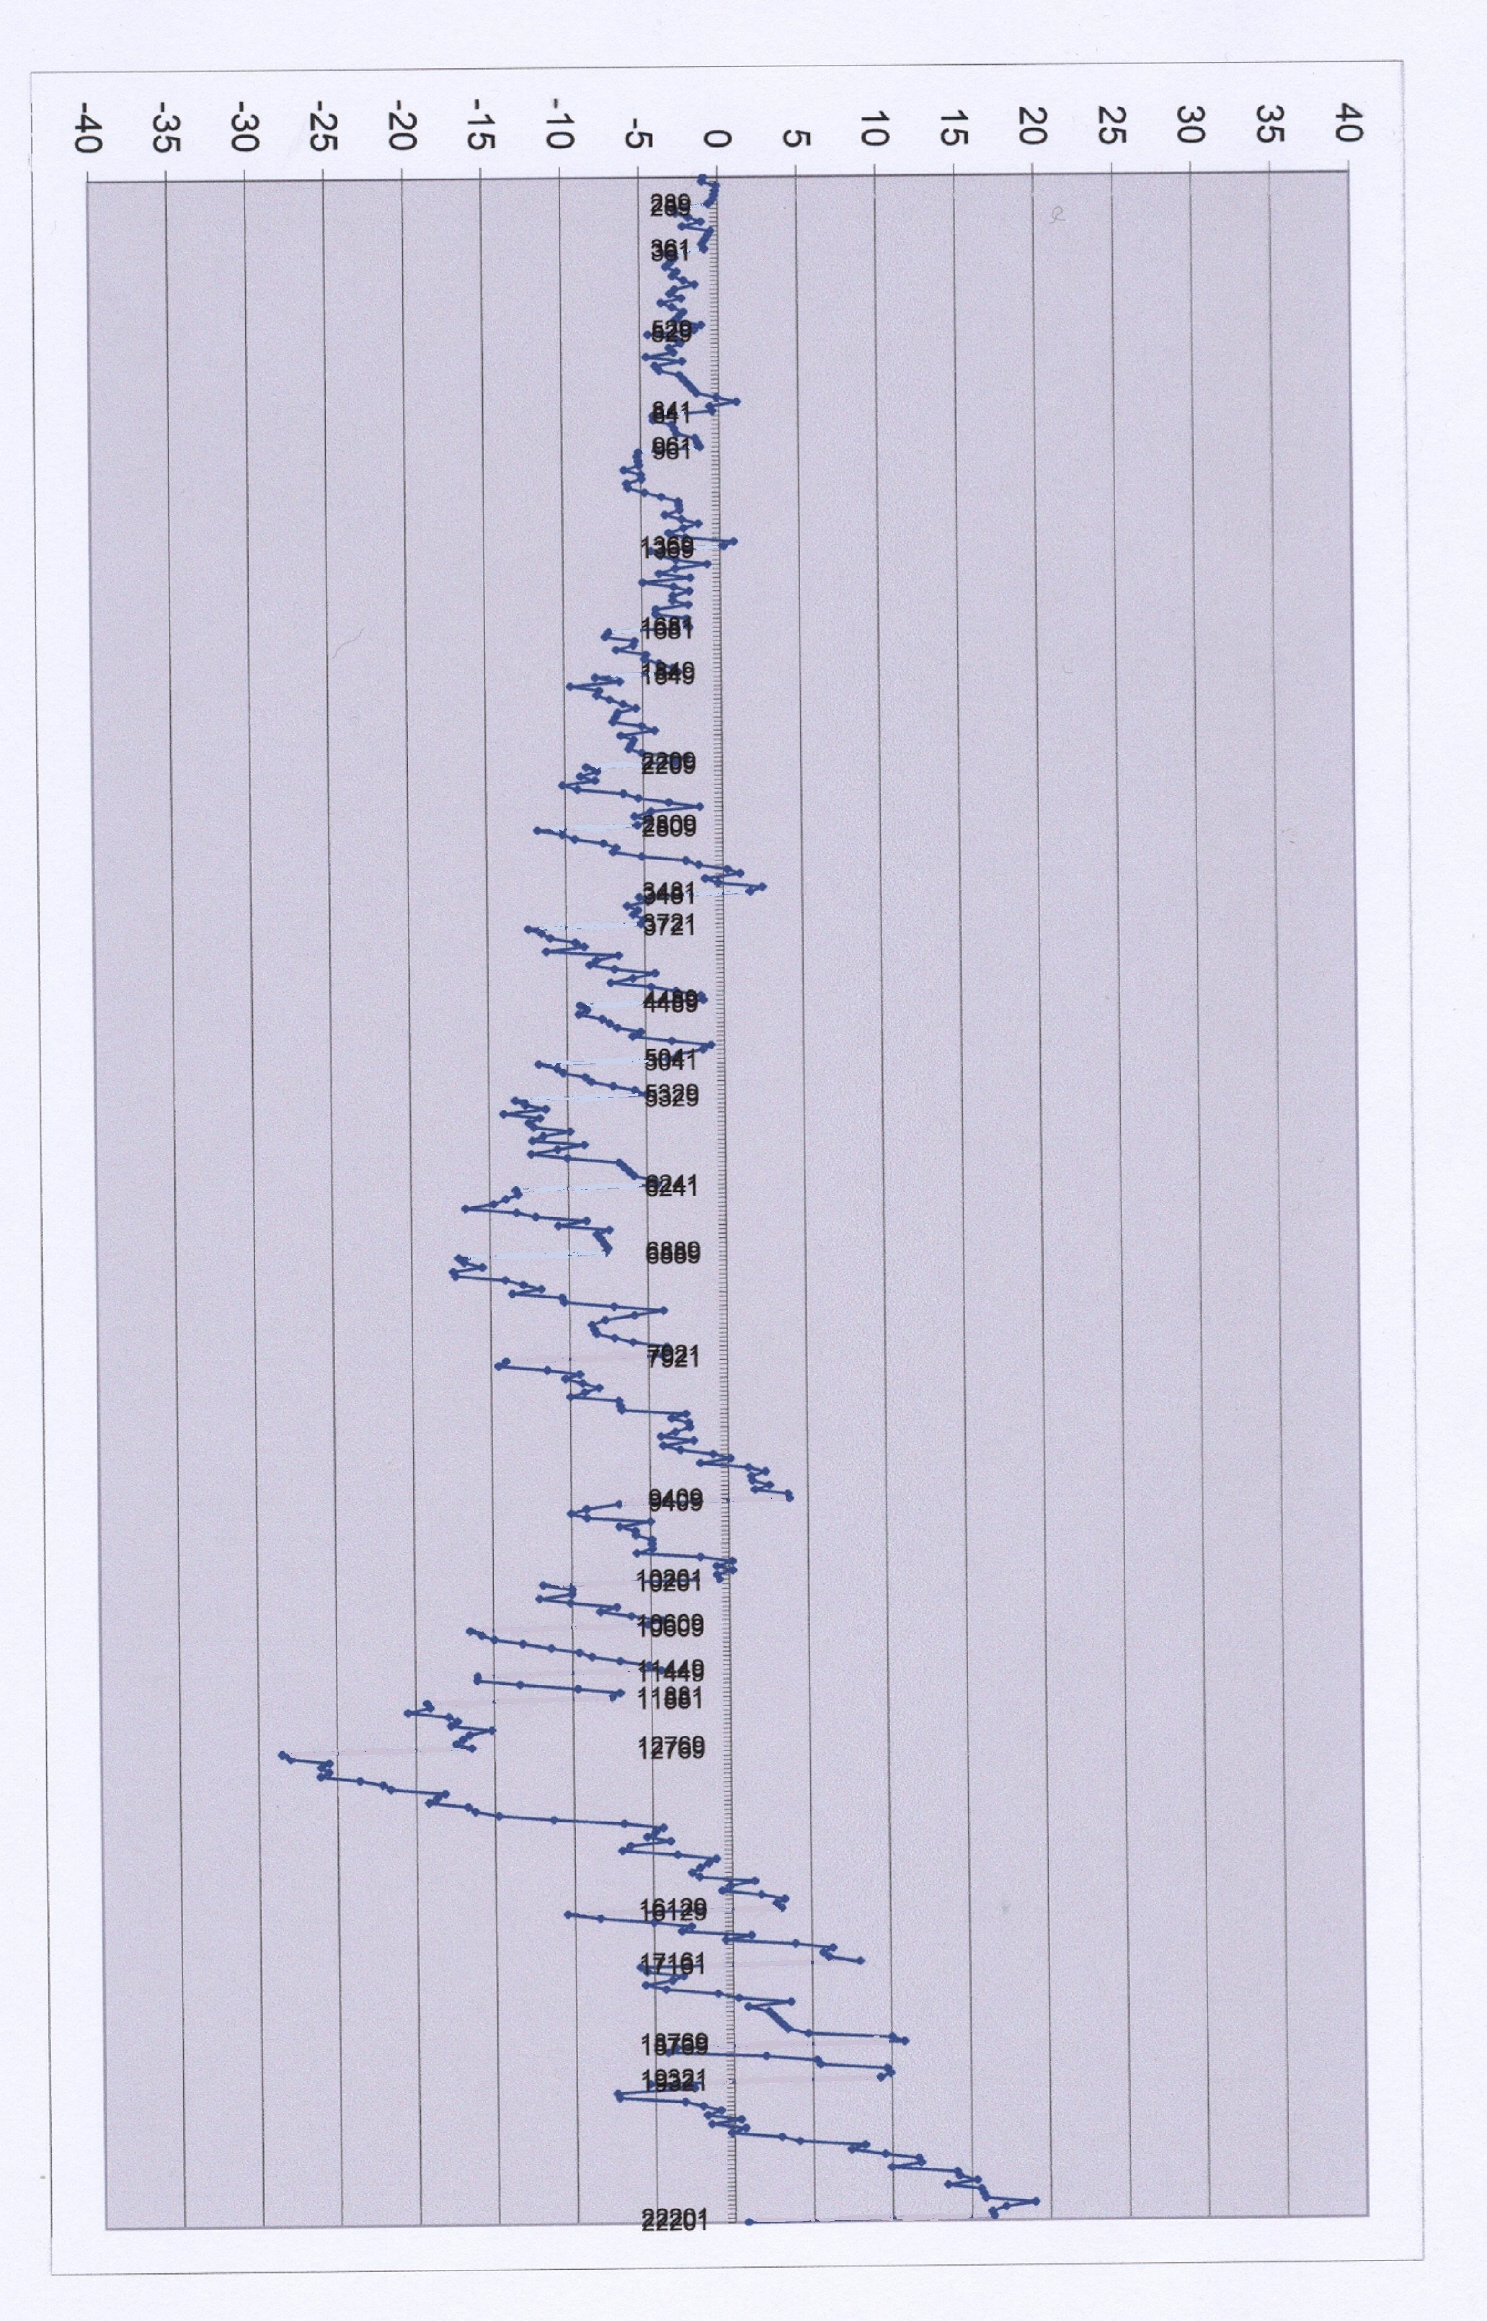
In tabledev are computed the api(x) values. The pi(x) values are also included and hence we are able to see the deviation between both values.
What can be observed by looking at the graph of this deviation is merely that a sort of "sawtooth range" is generated. Each tooth corresponds to a subsequence as introduced herabove.
Each time we reach a prime square, we see that two predictive values are obtained, in a fashion where we seem to allow that prime square to belong to two consecutive subsequences. As those values are simply predictive we might simply accept both, not discussing about a choice inbetween.
In the graph, this couple of values gets visualized as an abrupt decay in the apidev(x) "function". Let us call that shape of the graph the "abrupt side of the sawtooth".
As a matter of contrast the apidev(x) values within each subsequence present a positive slope, to the extent that the difference between apidev(x) at the end of a subsequence and apidev(x) at its beginning is always positive and regularly substantial. Let us call that shape of the graph the "gentle side of the sawtooth"
The overall behavior of our "sawtooth range" when x increases merely indicates the quality of that predictive function. This is like a battle between "gentle sides" and "abrupt sides" in the whole range.
As we observe, eventually the gentle side is the winner after a long period of hesitation. This is a bit of disappointment until we come to tackle the question : How to explain this, while we believe this probability-based function should only generate positive and negative fluctuation that would remain "centered", with the idea that "relatively small positive and negative error terms should vanish all together" ?
Paradoxically the simplest side to tackle is the abrupt sides of the the sawtooth range, just by formulating the value of the decay observed at each prime square. (This will be added later)
Indeed the other side, the "gentle side" lends itself to more work :
Let us be back to the formula applicable to one subsequence and develop the product into its terms. For example between 25 and 49
api(x) = 2 + x - x/2 - x/3 - x/5 + x/6 + x/10 + x/15 - x/30
If we think about the Eratosthene's sieve, we would develop an analog formula for the exact prime count :
pi(x) = 2 + x - int(x/2) - int(x/3) - int(x/5) + int(x/6) + int(x/10) + int(x/15) - int(x/30)
where int(x) abbreviates "integer(x)" also known as "floor(x)".
Hence we obtain for our deviation formula
apidev(x) = - mod((x/2);1) - mod((x/3);1) - mod((x/5);1) + mod((x/6);1) + mod((x/10);1) + mod((x/15);1) - mod((x/30);1)
where mod(a;n) abbreviates "modulo(a;n)" i.e. the remainder of the division of a by n, to the extent this formula can be used with a being a fraction rather than an integer and with the divisor n = 1.
The heart of this article is to study the values obtained with this formula, breaking our intuitive belief that they tend to vanish when x increases.
In table1 the development of all those deviation terms is shown for x = 842.
Here are some explanations about this table :
The very first column gives, for each line, the number of prime numbers involved in computing the denominator of a term of the api(x) formula. It serves to determine the sign of that term.
Then the range of columns "a to j" contains those prime numbers. As 29 is the biggest prime the square of which is lower than x=842, only 10 columns are needed to contain all the primes up to 29.
The column "l" (should appear exactly above the description "prod(a,j)" contains the product of the corresponding primes.
The column "m" contains the value "x/prod(a,j)" with the correct sign so as to appear in the pi(x) formula.
The column "n" contains the value "floor (x/prod(a,j))" with the correct sign so as to appear in the api(x) formula.
The column "o" is the difference between "m" and "n", i.e. the deviation.
Then the overall results of this itemization are gathered at the top of this excel table under the headings "m", "n", "o" :
In "m", the description "sum(l14:l1027)" suggests what applies to the unnderneath value ; the description "x-m3..." suggests the underneath value and equates api(x).
In "n", the corresponding sum is given, followed by the description "x-n3..." suggesting to obtain pi(x).
In "o", the deviation whichh the subject of our study.
As means of verification, column "m" contains a second api(x) computation, based on the product of the terms (1 - 1/p). The key ingredient is just in front of it in column "l", described as "den" : the "prime density" or the "prime probability" applying to the interval under study (841 to 961).
Hence the net result of this hefty table is to show the method used to compute and list all the terms participating in the generation of the pi - api deviation.
For x = 842, its shows a negative value -4.008..., which in itself is relatively small compared to the pi(x) and api(x) values.
The question that arises immediately is : what is its behavior when x increases. The answer can be seen by revisiting tabledev , and also visualized in a graph .
That answer is still unsatisfactory because the computation is given by steps of 10 ? Let us develop only the interval 841 to 961 by steps of 1 :
(to be continued)
Copyright Didier van der Straten 2004, 2005
home page