|
ECONOMICS |
- Concerned with the production of goods & services: the amount the economy produces in total, the combinations of goods & services, the amount firms produce, the production techniques used & the no. of people employed. - Concerned with the consumption of goods & services: the amount the whole population spends & saves, the consumption pattern in the economy, the particular individual chooses to buy, the amount people buy of particular items & the determinants of consumption habits. - Attempt to construct theories or economic models (A formal presentation of an economic theory) to explain & predict. |
| Applied Economics |
-Distinct from Economics theory -Applications of Economics theory in explaining economic activities. |
|
Economic models |
- Simplified representations of reality, showing the relationships between various economic phenoma, represented graphically or mathematically usually. |
|
Building models |
- Constructed by making general hypotheses about the causes of economic phenomena through induction ( constructing general theories through specific observations, simplifying assumptions, ignoring casual/minor factors. |
|
Usages of models |
- Explain economic phenomena like inflation - Predictions through deduction( Using a theory to draw conclusions aboutt specific circumstances, ceteris paribus.) |
|
Assesments of models |
- Judged according to successes in explanation/prediction. - If predictions were wrong: deduction errors are checked. If they were: it must be adapted or abandoned. If alternative model predicts better: original model is abandoned. If original model is adapted to improve powers in prediction: kept. Poor model showing insight of idealised world is kept. |
|
The Law of large number |
- The behaviour of an individual is unpredictable - In a large group of people, the larger is the number of individuals in it, the more predictable is the behaviour of the group of people as a group. |
|
Production |
- The transformation of inputs into outputs by firms for profits or other objectives. |
|
Consumption |
- The act of using goods & services to satisfy wants- usually involve purchasing the goods & services. |
|
‘Positive’ |
- Can be verified, to be proofed true or false by facts |
|
‘Normative’ |
- Not positive - Involved thing to do with value judgements like good or bad, ought or ought not to do things, - Not dealt with by economists, but they help to point out to governments the consequences of various policies. - Economists do not analyse normative statements on ideological grounds, but they say that the pursuit of a goal irrespective of its consequences may conflict with other goals. |
| Durable Consumer products |
- Something one buys and is not gone - Provides services over a period of time - e.g. Clothes, books |
|
Non-durable Consumer products |
- provides services that is used and gone - e.g. food & holiday |
| What? | production, quantity |
| How? | efficiency, ways of production, techniques |
| For Whom? | Distribution of Income |

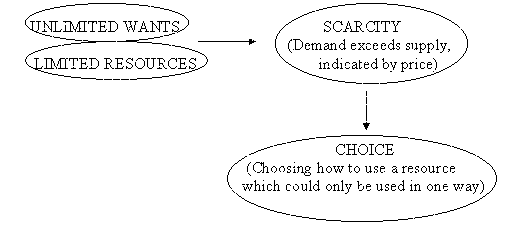
There is a problem of scarcity because there is a limited amount of resources, due to different factors of production:
|
Human resources |
- Labour, as human resources, both physical & mental into current production is limited in both size & skills. |
|
Natural resources |
- Land & raw materials are inputs provided by nature. Both are limited. |
|
Manufactured resources |
- Capital, consists of the inputs which have to be produced firstly, e.g. machines, factories. |
|
Scarcity |
- The excess of human desires over what can actually be produced to fulfil these wants. |
| Graphically |
- Illustrates relationships clearly & simply.
|
| Time-series data |
- Information depicting how a variable changes over time. - Can be represented graphically, or with a table. - Graphical presentation gives a clearer representation of trends, and whether the changes are getting bigger (curves getting steeper) or not. - Graphically, two sets of time-series data can be drawn on the same graph to show their relative movements over time. Two sets of vertical axises could be used if they are measured in different units. |
|
Cross-section data |
- Information showing how a variable differs between different groups or individuals at a given time using a histogram or pie-chart. |
Statistics
Different individuals/groups use statistics to prove their point, giving a grossly distorted picture of reality.
|
Selective use of data |
- Individuals/Groups choose only to use those statistics that support their case & ignore those that don’t. |
|
Graphical presentation |
- Different impressions could be given graphically, using different types of graphs/scales for the axes(which determines the shapes of curves). |
|
Absolute/ proportionate values |
- E.g. Absolute value of income tax: the amount of tax you pay in total, dependant upon your income & tax rate. (In £) - Proportionate value of income tax: the amount of tax as a proportion of your income you pay. (In %) |
|
Ignoring distributions |
- The state in general & that of a particular (e.g. the rich) could be completely different. - The arithmetic mean(average) is the sum of each values of the samples divided by the number of samples. - The median is the value of the middle number of the samples. |
|
Real/nominal value |
- Nominal values are measured at current prices. - Real values are corrected for inflation. |
|
Time period |
- Within a time period of time, there could be, e.g., a positive economic growth, but also a period of negative economic growth, which could be included or excluded. |
|
Taking into account of the population |
- E.G. Two countries of identical GNP could have very different GNP per capita, and hence standards of living. |
Index numbers
|
Index number |
- The value of a variable expressed as 100 +/- its percentage deviation from a base year. - Allows easy observation of any upward/downward movements. - Allows easy comparison of multiple time series data. |
|
Base year |
- Selected for Index no., where the index no. is 100. |
|
Measurements of % changes with Index No. |
- Annual percentage growth rate is defined as: [It – It-1] / It-1 x 100%, where It is the index no. of the year concerned. |
|
Retail Price Index (RPI) |
- An index of the prices of goods/services purchased by a typical household. - Shows how the cost of living changed. - Inflation is defined as the annual increases in the RPI. |
|
Weighted averages |
- The average of several items where each item is ascribed a weight according to its importance. Weights add up to 1. - E.G. If the output of Industry A & B were £80M & £20M in the base year and that A & B are the sole industries, A is given a weight of 0.8, B has a weight of 0.2. Industry index is given as the Index no. x Its weight. Hence: a decline in output(index), does not mean a decline in the industry index no. |
|
RPI calculations |
- Firstly: products are grouped into categories like food, with a weighted index worked out for each group [e.g.: weighted average index of food is that of bread, potatoes etc.] - Then, a weight is attached to each of the groups to give overall index. |
|
Functional relationships |
- Mathematical relationships showing how a variable is affected by one or more others. - Can be represented graphically, with a function [e.g.: Y=f(x)], - The degree of dependence of a variable can be presented by - A table - A graph with the independent variable on the x-axis and the dependent variable on the y-axis. - A equation [e.g.: y = a + bx, where a is the y-intercept, & b is the slope] - Non-linear functions are expressed as y=ax2 + bx + c |
Different types of economic systems
|
Public sector |
- State own - Central government - Local government - Nationalised industry - 40 - 45 % spending of all economy in capitalist countries - Most (>95%) belongs to the public sector |
|
|
Private sector |
- Market sector | |
|
Commanded Economy |
- Centralised, associated with socialism and communism - All economic decisions are taken by the central authorities. - Central authority plans the allocation of resources between consumption & investment for future. - Diverting consumption to investment could increase economic growth rate which is dependant upon its broad macroeconomics strategies. - Plans the output of each industry & firms, techniques used, labour & other resources required by each industry & firm for microeconomics. To do so, input-output analysis (involves dividing the economy into sectors where each sector is a user of inputs from and a suppliers of outputs to other sectors. It examines how these inputs & outputs can be matched to the total resources available in the economy) is used.. - It plans the distribution of outputs to consumers: e.g.: distribute goods according to people’s needs, give more to people producing more to give incentives for hard working. - It could distribute goods/services directly or distribute incomes & use prices to control consumption. The theory: - Decisions are always In the interests of society as a whole. The government could take an overall view of the economy, directing the nation’s resources with specific goals.- High growth rate can be achieved through directing most money into investment - Unemployment could be avoided through careful planning & allocation of labour in accordance with production requirements & labour skills. - National income could be distributed equally/in accordance with needs. - Social repercussions of production & consumption can be taken into account. In practice: - The larger & more complex is the economy, the greater is the task of collecting & analysing the information for planning, the more complex is the plan & the more costly it is to administer & involve cumbersome bureaucracy.- No price mechanism/set by the state arbitrarily® inefficient use of resources, difficult to assess the relative efficiency of 2 alternative techniques used in inputs, no ways of ascertaining the value of those inputs. - Difficult to devise appropriated incentives to encourage workers & managers to increase productivity without sacrificing quality. - Complete state control over® lost of individual liberty: workers have no choice of where to work, consumers cannot what to buy. - Government may enforce unpopular plan. - Planned but freed to purchase® government could not avoid shortages & surpluses. |
|
|
Free-market Economy |
- Does not really exist in reality - When there is a government, there will be tax, then it will not be completely free. - Pure capitalist systems where land & capital are privately owned. All economic decisions are taken by households/ firms which are assumed to act in their own self-interest: - Firms seek to maximise profits, - Consumers seek to get the best value for money from their purchases. - Workers seek to maximise wages relative to the human cost of working in a particular job - Individuals (consumers & firms) are assumed to be free to make choices. Supply & demand decisions of firms/households® ransmitted to each other with ‘prices’ - Free market economy functions automatically® no costly & complex bureaucracies to co-ordinate economic decisions - Highly competitive market® no one has great power® increase efficiency of firms keeping prices down. Greater competition® more responsive to consumers’ wishes. - People pursue their own self-interest in competitive market. Firms for profits, workers for secured jobs, higher wages, consumers for saving money® minimise scarcity, encouraging efficient use of the nation’s resources in line with consumer wishes. - Markets are not perfectly competitive: giant firms dominate industries® high price, more profits. Firms advertises. - Lack of competition, high profits® less incentives for higher efficiency. - Unequal distribution of power & property: those with power &/or property will gain at the expense of those without them. - The practices of some firms are socially undesirable: e.g.: pollution. - Private firms may not produce merit goods. - Ethical objection- self-interested behaviour, selfishness, etc. |
|
|
Price Mechanism |
- The system in a market whereby changes in price in response to changes in demand & supply(shortages/surpluses) have the effect of making demand equal to supply. - A Change in demand causes price changes, ceteris paribus. A rise in price® shortages® higher prices® incentives for firms to supply more, diverting resources from other lower profit goods. A fall in demand® surpluses® profitability drops® incentives for supply to fall. - A Change in supply causes price changes, ceteris paribus. A rise in supply® surpluses® price fall® demand increases. A fall in supply® shortages® price rises® demand decreases. - The price acts as signals & incentives |
|
|
Mixed economy |
- Existed due to the problems of pure free & command economy. - The government may control: - The Relative prices(The prices of one good compared with another) of goods/inputs through subsidies/taxes/price control). - The relative incomes through income taxes/welfare/direct control over wages, profits, rents, etc. - The pattern of production/consumption, by legislation, direct provision of goods/services, taxes/subsidies/ nationalisation. - Macroeconomics problems (unemployment, inflation, lack of growth & balance of payment deficit) controlled by taxes, government expenditure, controlling bank loan interest rates, control of prices/incomes/foreign exchange rate. |
|
|
The interdependence of markets |
Goods market Demand for the good rises® shortages® price rise® eliminates shortage by choking off them demand & encouraging production. Sg /Dg ® shortage (Dg>Sg) ® Pg until Dg = Sg Dg¯ Factor market Increase supply of the good® increase in the demand for factors of production used to make it® shortages of inputs® price rises® eliminates shortages by choking off demand & encouraging the suppliers of inputs to supply more. Si /Sg ® Di ® shortage (Di > Si) ® Pi Di = Si Di¯ |
|
Opportunity Costs
|
Opportunity cost |
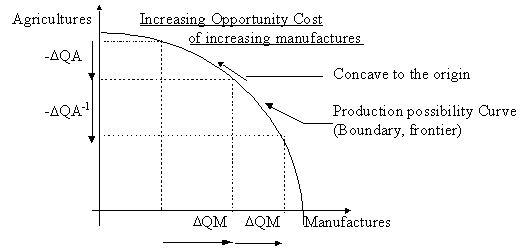
- Resources could only be used in one way or another - The opportunity cost of using a given resource in a particular use is not being able to use that same resource in its next best alternative use |
|

Initially, when the resources are shifted from Agricultures to manufactures, the opportunity cost for Agricultures(-D QA) is not too large. This is because the resources are not very productive in Agricultures, and may be better suited to work in the manufacturing sector. However, when more resources are shifted to the manufactures from the Agricultures later, the opportunity cost for the Agricultures(-DQA-1) is much larger for the same increase in manufactures(D QM). This is because the resources shifted to manufacturing are more productive in Agricultures than the resources initially shifted, and may have less potential in the manufacturing sector.

The increasing opportunity cost in achieved because not all resources are uniform in productivity, some are better suited in sector than the other.

For consumption, constant opportunity cost usually applies, for manufacturing, increasing opportunity cost mostly applies.
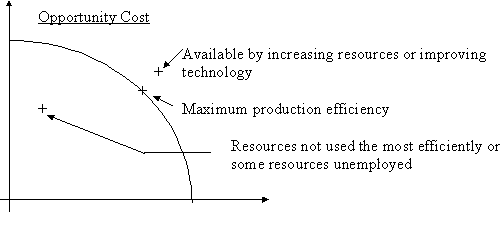
Over time, production possibility of a nation is likely to increase through investment (The production of goods that are not for immediate consumption) in machinery etc. which can increase the stock of capital. Also, new raw materials could be discovered, technology may advance, labour could be more productive through education & training.
Circular flow of goods & incomes

|
Rational choices |
- Refer to weighing up of the costs & benefits of any activity by economists. - For consumers, it means choosing items that give you the best value for money- greatest benefit relative to money. - Marginal costs & benefits are often considered |
|
Aggregate demand |
- The total level of spending in the economy | |
|
Aggregate supply |
- The total amount of output in the economy. | |
|
Inflation |
- The rise in the level of prices throughout the economy. Aggregate demand increases® firms may raise prices, because they can sell as much as before due to the excess demand.
|
|
|
(Current account) balance of payment |
- Export of goods & services minus imports of goods & services.
- If aggregate demand is too low relative to aggregate supply® unemployment & recession. |
|
|
Recession |
- A period where national output falls for a few months r more. - Associated with low level of consumer spending. - Low consumer spending® retailers buy less® cut production. |
|
|
Unemployment |
- The no. of people who are actively looking for work but are currently without a job. - Likely to be resultant from cutbacks in production® smaller work force needed. |
|
|
Macroeconomics policy |
- Focus to balance aggregate demand and aggregate supply. | |
|
Demand-side policy |
- Seek to influence the level spending in the economy® level of production, prices & employment affected. | |
|
Supply-side policy |
- Influences the level of production directly (e.g. create incentives for workers & businesspeople). | |
|
Micro economics |
- The study of fundamental forces determining units within the economy. Rational choices are also studied. | |
|
Marginal costs |
- The additional cost of doing a little bit more (1 unit more if it can be measured quantitatively. - Marginal cost= Change in Total Cost / Change in quantity |
|
|
Marginal benefits |
- The additional benefits of doing a little bit more (1 unit more if it can be measure quantitatively. | |
|
Social implications of choice |
- The consequences of choices are studied. - E.g. choices made by government or individual may involve consequences such as inefficiency, waste, inequality or pollution. |
|
|
Households |
- Fundamental consuming units - Optimisation in purchasing |
|
|
Firms |
- Fundamental production units - Assumptions on intentions: profit maximisation, motives |
|
|
Free goods |
- Goods which command a price as it is not scarce | |
|
Economic goods |
- Command a price | |
|
Private goods |
- Economic goods - Produced by the private sectors(firms) for profits, achieved by charging for products exceeding the costs. - non-payers are excluded. |
|
|
Public goods |
- Economic goods - Provided by the state (Public sector) because they cannot be provided for profits by the private sector. - Their consumption cannot be confined only to those who pay. Non-payers could not be excluded. It is financed through taxation. - Non-diminishability: the consumption of the good by one does not diminish the amount available to others. - E.g.: Roads, national defence, street lighting |
|
|
Collected consumption goods |
- Goods that are consumed collectively, a public good. - E.g.: National defence, general policing |
|
|
Quasi-public goods |
- ‘Almost’ public goods - Mostly provided by the state, but some are provided by the private sector, because the state thinks it is right for it to do so. - It is often provided at zero price from taxation. |
|
|
Merit goods |
- Quasi-public goods. - Confer benefits on those other than the consumers - E.g. the more people are better educated, the better will the society & the economy will be. - Hence, it have private cost and external benefits |
|
|
De-merit goods |
- Confer harms to others as well as the consumers - E.g. illegal drugs, tobacco - Have external costs |
|
|
Private cost |
- Paid for by the consumer for the consumption of a product. | |
|
External cost |
- Imposed on others that the consumers do not pay for directly at the point of consumption | |
|
Social cost |
- Private cost + External cost - To internalise externalities, cosumers are made to pay some external cost, by taxation, for instance. It also deters the use of de-merit goods. - Negative externalities is the characteristics of a de-merit good. - Positive externalities is the characteristics of a merit good. - Social equilibrium of input & output: marginal social cost = marginal social benefit. |
|
|
The theory of demand |
- Supply & demand are the 2 fundamental economic forces. | |
|
Macro-economic demands |
- The study of demands in the market as a whole - The demands of products & services |
|
|
Micro-economic Demands |
- The study of demands of household | |