Market Benchmarks
| Go Home |
(This page is updated at least once per week, visit frequently; last update on 30 May 2002.)


In economic analysis, one answers such questions as what is the current strength of the economy, what is the outlook for employment and inflation, and where is the economy in terms of the business cycle. Over the long run, the most important force behind the market is the economy. Over shorter period, the link between market and economy is much weaker. When several signals that gauge the status of the economy are overwhelmingly pointing toward a decline, a major market correction appears to be imminent.
In the following paragraphs, several indicators for gaging the status of the economy are described, the interpretation of the signals are discussed, and the current economic data are presented. The price and volume patterns in NYSE and NSDQ are analyzed. A handy calculator predicts whether Greenspan will raise or lower the fed funds rate.
Productivity measures the economic efficiency that shows how effectively the economic inputs are converted into outputs. When we produce more service or goods with a proportional increase in labor time, the productivity does not change. However, when we produce more with same or lesser amount of labor time, we are producing more efficiently and thereby we increase productivity.
Bureau of Labor Statistics measure productivity by calculating the ratio of the output of goods and services to the labor hours devoted to that production.
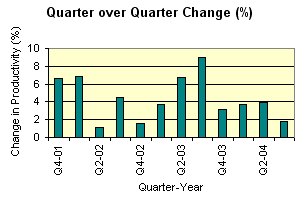
In the Figure below, % change in productivity from one quarter to the next is plotted. Over a period from 1992-2001, the average quarterly change in productivity is 3.9%. Any monthly value larger than 3.9% indicates strong economy.
(More on Productivity )
Go to the Top of the PageThe PMI is published by the Institute of Supply Management (ISM). The ISM publishes two Reports on Business (ROB) per month-- Manufacturing ROB and Non-manufacturing ROB.
The Manufacturing ROB is based on data compiled from monthly replies to questions asked of purchasing managers in over 350 industrial companies. Twenty industrial sectors from various US geographical areas are chosen. The questions ask if the condition is better, worse, or same in the following areas of business - new orders, backlog of orders, export orders, import orders, production, supplier deliveries, inventories, employment, and prices. The result is the percentage of the 350 managers that report strong business conditions for their particular firm.
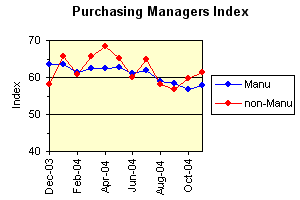
The Non-Manufacturing ROB is based on data compiled from monthly replies to questions asked of more than 350 purchasing executives in over 62 different industries. The responses are sought on 11 categories: business activity, new orders, backlog, export, inventory, supplies, employment, etc. In the following chart, the Index for Business Activity is plotted.
The Manufacturing and the Non-Manufacturing (Business Activity) Indices typically range between 40% and 60%. In the best of economic times, 60% of US businesses are doing well. For a period of over 15 years, the PMI has not given a false signal about the state of the economy.
A PMI reading above 50 indicates expanding economy; below 50 indicates generally declining economy.
(More on PMI )
Go to the Top of the PageThe concept that we need to develop is the possible relationship between federal economic policy, market condition, inflation, price of bonds, and yield.
At take-off, when a bond is sold for the first time by the treasury, its price is $100. When it is bought and sold by investors and bond dealers/traders, in the open market, its price is controlled by various market forces. As the price of a bond changes, so does its effective yield. The yield is of two kinds - current yield, and yield to maturity. The current market conditions control its current yield and thus, we will focus on the current yield only.
Say, you bought a 6% interest paying, 5-year bond for $100. Every year, you will get $6 from the government as interest payment. Also assume that after a few months, a 7% interest yielding bond becomes available in the market. Many investors will rush to buy the new, higher interest paying bond and increase its demand. As demand controls price, the treasury dealers will sell the new, 7% interest paying bond at a price higher than $100, say $104. Those who buy this new bond at $104, will earn $7 per year, at the 7% rate. However, their effective yield is (700/104=) 6.73%. This calculation demonstrates two ideas: (i) The interest rate and yield are different. (ii) When the price of a bond goes up, its yield drops.
The old, lower interest paying bond becomes less attractive and its demand drops. Assume that it can be sold for $93 in the open market. The buyer of your bond will get $6 from the government as interest payment at the 6% rate. The effective yield for the buyer is (600/93=) 6.45%. Thus, when the price of a bond drops, its yield increases.
The Economy: When the economy is expanding, consumers need cash for large purchases, businesses need cash to build inventory or plants. As the demand for funds grows at a rate faster than the growth in savings, interest rates rise.
Inflation: Inflation reduces the buying power of cash. Thus, the lenders charge higher interest rate to compensate for the reduced buying power of their cash when it is paid back by the borrower, after a length of time.
Bond-seller gets the cash from the buyer, thus the seller is the borrower. Bond-buyer is the lender, because the buyer gives the cash.
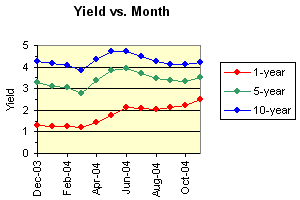
Month to month change of the yield of constant maturity treasury securities of three durations - 1-year, 5-years, 10-years.
During the very late stages of economic expansion or when the fear of inflation is at its peak, the interest rates are at its highest and they are likely to fall in the future. The borrowers (bond sellers) are not interested in long term bonds, with its current highest rate, and thus they reduce the supply of long term bonds. With lower supply, the price of long term bond rises and yield falls. In some situations the yield of long term bonds can become less than the short term bonds and that results in an inverted yield curve.
During the late stage of the economic contraction or when there is no fear of inflation, the interest rate is at its lowest and is expected to rise in the future. The borrowers (bond sellers) like the long term bonds and its supply is increased. With increased supply, price falls and yield of long term bonds rises.
Thus, the rule of thumb is: Long term yield close to or below short term yield signifies late expansion or fear of inflation. Long term yield rising at a faster rate than the short term rate signifies early expansion and no fear of inflation.
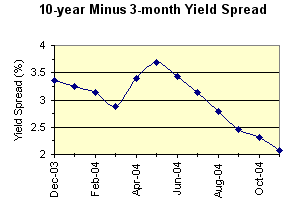
Month to Month Change in Yield Spread
It is advisable to follow the difference between the yield from a 10-year maturity security and the yield from a 3-month maturity security. This quantity is called the yield spread. The spread begins to expand at the beginning of an expansion, hitting a maximum at the peak of expansion. The spread begins to shrink as fear of inflation grows and hits the bottom at the end of the economic cycle.
(More on Interest Rate )
Go to the Top of the PageMoney supply growth can be calculated from three different quantities, e.g., the Adjusted Monetary Base (AMB), M1, and M2. Fed has greatest control on AMB which is composed of currency in circulation and deposits by commercial banks at the Fed. AMB is only a small fraction of the money actually used by businesses and consumers for day-to-day transactions. M1 is the sum of AMB and the checking account balances. Thus, M1 is closer to what is actually used by the market participants. An even broader measure is M2 which includes M1 along with savings and other deposits.
Studies show that growth in M2 is closely related to inflation and GDP growth. If the money supply grows too fast, then inflation results and inflation cuts down on GDP growth and consequently return from stock. This is an investor's worst fear. If money supply grows too slowly, then economic growth may be stunted.
The Fed usually lowers the money supply by increasing the interest rate, and raises the money supply by lowering the interest rate. Thus, when Fed decides to raise interest rate, it usually means that money supply growth is excessive and inflation is rising. When Fed decides to lower the interest rate, it usually means that money is scarce, money supply growth rate is low, and there is no fear of inflation.
An annual growth rate of 5% in money supply is desirable. This is consistent with 2% inflation and 3% real GDP growth. However, an annual growth rate of more than 6% in money supply is unhealthy for the economy.
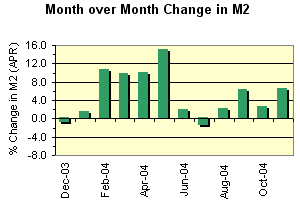
The annual growth in M2 is calculated by employing a weighted average of twelve monthly growth rates of M2. In my analysis, I have found the following formula to be particularly useful. In this formula, m(0) denotes current month's M2 growth rate, m(1) denotes the growth rate a month ago, m(2) denotes the growth rate two months ago, and so on. If the annual M2 growth rate is denoted by M, then
Each country keeps track of inflation by looking at the prices of a group or "basket" of consumer goods and services. This cost of goods and services in the "basket" is called the CPI. Inflation is defined as the percentage rise in CPI over a given period. Deflation is a decline in CPI. The Conference Board publishes CPI for each month. The month by month percentage change gives the monthly rate of inflation. Some averaging of the monthly inflation over twelve months gives the annual rate of inflation.
In a booming economy, inflation begins to rise as consumers and business compete with each other for goods and services, bidding up prices to buy a limited quantity of products. The increase in prices leads workers to ask for more salary. The result is often a vicious cycle of wage and price increase.
When government sees the signs of inflation, it slows the economy down by increasing the interest rate. Higher interest rate makes all buying activities, such as buying a car, building a house, or building a new factory, more expensive. In general, higher interest rate discourages individuals and businesses to spend.
On the other hand, favorable inflation and lower interest rate attract investors, companies, and foreign investors to invest in the US economy.
Thus, continuous or accelerated rise in CPI is unfavorable for growth.
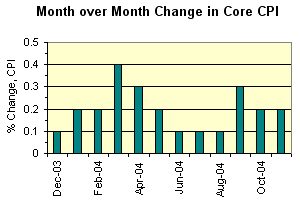
In the following chart, the month over month change in seasonally adjusted, core CPI is plotted. The core CPI excludes the change in food and fuel prices. These prices are excluded, because they are so volatile, depending on the weather in the case of food and on the whims of foreign oil producers, in the case of fuel.
(More on CPI )
The annual growth rate of inflation can be calculated as a weighted sum of the growths in CPI for the twelve, preceding months. The formula that I have developed is:
where C is the annual inflation, C(n) is the month by month change in CPI. C(0) is the current month's change in CPI and is given the highest (20%) weightage.
PPI is an index of inflationary trend. It is based upon the change in the price of finished goods that are ready to be moved to the marketplace. The price includes the cost of labor, cost of material, energy required for production, capital expenses, transportation, marketing, etc. In the basket of products, 76% represent consumer goods and 24% represent capital equipment (cranes, machines, earth movers, printing presses, etc. that are purchased by producers and service providers).
PPI is more volatile compared to CPI. PPI is more fundamental in the sense that cost to producers is finally transferred to the consumer. Thus, change in PPI ultimately affects the goods prices in the CPI.
One shortcoming of PPI is that it reflects prices of products only, not services.
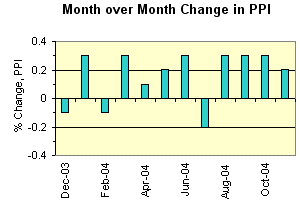
In the figure below, the month-over-month % change in the seasonally adjusted, core PPI is plotted.
The annual, growth rate of PPI is calculated as a weighted average of the twelve, preceding month's growth in PPI. The formula that I have developed for such calculation is:
where I is the annual growth in PPI, I(n) is the month by month change in PPI. I(0) is the current month's change in PPI
The average inflation rate computed from the CPI and PPI is 1.61%
Consumer Confidence Index (CCI) is published once a month by the Conference Board. The survey is based on the responses from a sample of 5,000 US households. The monthly survey is conducted by NFO Research, Inc., of Greenwich, Connecticut. The CCI is scaled in such a way that 1985 index equals 100. Drop in consumer confidence signals possible market correction.

(More on CCI )
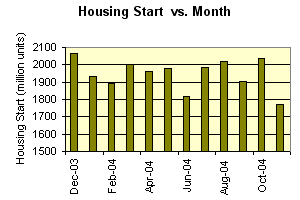
Another sign of consumer confidence is the number of new housing permits issued. Citizens plan to build new homes when they anticipate improvements in their financial condition due to increased salary, due to comfortable savings, and due to absence of immediate fear of loss of employment. In general, an increase in the number of housing permits is a result of improved economy or an expectation of improved economy. Furthermore, new housing feeds the improvements in economy through increased real-estate tax base, enhanced banking activity, and additional cash flow into the home building industry.
The average number of housing starts over a 21-year period, from January 1959 to December 1979, for the entire nation is 1580 million units per month.
In the figure below, the number of new housing permits is plotted against month. Data from January 1982 to December 2001 show, housing start below 1355 million shows weak, between 1355 and 1600 million shows neutral, and above 1600 million shows strong economy.
(More on Housing Start )
Go to the Top of the PageGross Domestic Product (GDP) is a measure of the output of goods and services produced by labor and property located in the United States. GDP has the following components and sub-components:
The total GDP in billions of dollars is obtained by adding the dollar value associated with each of the components. The Bureau of Economic Analysis (BEA) of the US Department of Commerce does this calculation.
The practice of expressing GDP in straightforward dollar-value hides some important pieces of information. For example, it is impossible to distinguish the contributions from changes in price and changes in physical output. In order to circumvent this problem, the Commerce Department introduced a statistical procedure called "chain weighting". Without getting into the details of this procedure, we simply state that the GDP is expressed in terms of 1992 chained dollars.
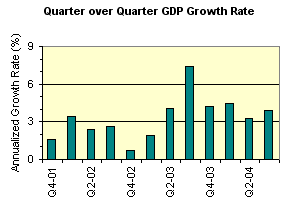
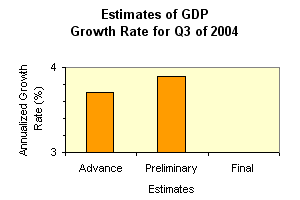
Each month, BEA publishes the quarterly GDP estimates. For the first quarter (January to March), an "advance" estimate is published in April, a "preliminary" estimate is published in May, and the "final" estimate is published in June. This pattern then continues for the subsequent quarters.
The pulse of the economy can be gauged from the GDP growth rate in two ways:
In the two figures below, these two trends are shown.
(More on GDP)
Go to the Top of the PageNumber of job losses due to layoffs is a clear indicator of economic expansion or contraction. Shrinking profit, cancellation of existing products, large inventory build up, shortage of cash, reduced borrowing power, reduced demand, all of these cause layoffs in businesses.
The average number of unemployed civilian workers over a 10-year period, from January 1991 to December 2000, is 7.425 millions.
In the following figure, the percentage of unemployed civilian workers of age 16-years or older is shown. Unemplyment between 5.6% and 7.1% shows neutral state of the economy, a number above 7.1% shows shrinking economy, and a number below 5.6% shows expanding economy.

(More on Unemployment)
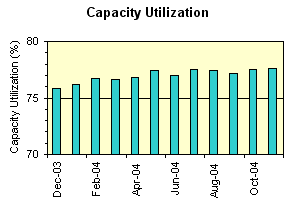
Go to the Top of the PageThe capacity utilization rate cover the manufacturing, mining, and electric and gas utilities. These sectors, together with construction, account for the bulk of the variation in national output over the course of the business cycle. The detail provided by capacity utilization helps measure developments in the economy.
The average industrial capacity utilization over a 10-year period, from January 1991 to December 2000, is 81%.
In the figure below, the capacity utilization is shown. A capacity utilization value larger than 82% indicates strong economy.
(More on Capacity Utilization )
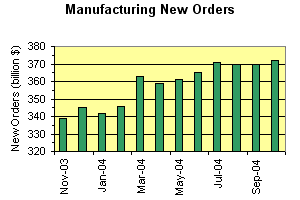
Go to the Top of the PageNew orders in the manufacturing sector influences the growth in the economy more than anything else. New orders indicate vanishing inventory, consumer demand, and innovation and development.
The average value of new orders in manufacturing over a 8-year period, from January 1993 to December 2000, is $305 billion.
In a figure below, the value of new orders in manufacturing is shown. A value larger than $325 billion shows strong economy, a value between $285 billion and $325 billion indicates neutral economy, and a value less that $285 indicates weak economy.
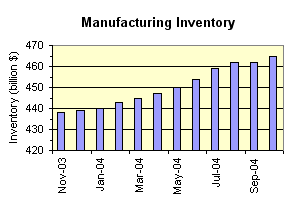
Also shown in a figure below, is the manufacruring inventory. An inventory build-up shows a weakening economy. In a strong economy, goods should be sold as soon as those are produced due to high demand in a growth atmosphere. Over a nine year period from January 1993 to December 2001, the average inventory is worth $427.5 billion. In a weak economy, inventory is above $445 billion. An inventory between $445 billion and $410 billion shows neutral economy. When inventory is below $410 billion, the economy is strong and advancing.
(More on Manufacturing New Orders )
Go to the Top of the PageIn the following color-coded Table, green is positive, red is negative, and white is neutral.
| Productivity | Above average |
| Purchasing Managers Index | Above 50 |
| Inflation | Low |
| Money Supply | Sufficient |
| Yield Curve | Upward Sloping, Flat Spread |
| Consumer Confidence | Improving |
| New Housing Start | Moderate |
| Unemployment | Moderate |
| Capacity Utilization | Low |
| New Orders/Inventory in Manufacturing | Neutral |
| GDP Growth Rate | Neutral |

We will define an accumulation day in the market as a day when price rises with rising volume compared to the previous trading day. Similarly, a distribution day is when price declines with rising volume compared to the previous trading day.
Over the last twenty days in the market, if the distribution days far out-number the accumulation days, the market is "bearish". Conversely, if the accumulation days out-number the distribution days, then the market is "bullish". For nearly equal number of accumulation and distribution days, the market is neutral or undecided.
In the following Table, the accumulation and distribution days for NYSE and NASDAQ are listed. A day is marked by "D" for distribution, "A" for accumulation, and "N" is for neutral. In the rightmost column of the Table, the "nature" of the day is characterized by down, up, or flat.
| Date | NYSE/DJIA | NASDAQ | Nature |
|---|---|---|---|
| May 1 | N | D | Down |
| May 2 | N | N | Flat |
| May 3 | N | N | Flat |
| May 6 | N | N | Flat |
| May 7 | A | D | Flat |
| May 8 | A | A | Up |
| May 9 | N | N | Flat |
| May 10 | D | D | Down |
| May 13 | N | N | Flat |
| May 14 | A | A | Up |
| May 15 | D | N | Down |
| May 16 | N | N | Flat |
| May 17 | A | A | Up |
| May 20 | N | N | Flat |
| May 21 | D | D | Down |
| May 22 | N | A | Up |
| May 23 | A | A | Up |
| May 24 | N | N | Flat |
| May 28 | D | D | Down |
| May 29 | D | D | Down |
Five up days and six down days in the last twenty trading days - market is neutral. In the short term, over the last ten trading days, market is neutral with three up days and four down days.
If you want to predict the movement of the Fed Funds Rate at the next Federal Open Market Committee (FOMC) Meeting, use the following calculator. You can also predict the direction (up, down, or unchanged) of Fed Funds Rate for any month within the next year. However, the calculator is very reliable if the FOMC meeting is less than two weeks away.
If you want to know the probability of rate change in a particular month, you need the "settle" value of the 30-day Fed Funds for that month. For example, if you want to know which way Mr. Greenspan will push the rate on June 26, 2002, you need the settle value of 30-day Fed Funds. The Chicago Board of Trade (CBOT) web-site lists the settlement values of various securities. Go to the Table for 30-day Fed Funds. In this Table, read the "settle" value for July 2002. Enter this value in the calculator. Here is the link to CBOT.
| FOMC Meeting Dates for 2002: January 29-30, March 19, May 7, June 25-26, August 13, September 24, November 6, December 10 |