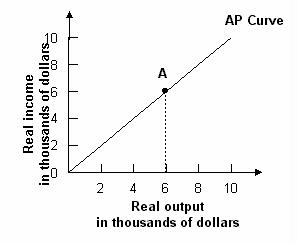
Refer to the graph above. The AD and AS curves would be correctly placed on which set of axes?
In the graph above, point A represents
Refer to the graph above. If income equals $2000 billion, expenditures equals:
Equilibrium real income given the graph above of the AP/AE model is
This is the end of the test. When you have completed all the questions and reviewed your answers, press the button below to grade the test.