THE PERFECTLY
COMPETITIVE
MODEL
PERFECT COMPETITION: economic
rivalry between autonomous units of capital seeking to maximize profits
and avoid losses, without government intrusion.
THE PERFECT ARTICULATION OF THE INVISIBLE HAND
this does not exist in reality, but there are some approximations
Commodity & Stock Mkts. -- auction mkts.
Sports -- Free Agency
Relative to other countries the U.S. is more
competitive
===================================================
Perfect Competition is based on the following
ASSUMPTIONS:
1. Buyers & Sellers are price takers (Mkt.
S&D=P)
2. The number of firms is large
3. There are no barriers to entry
4. Products are homogenous
5. Entry & exit are instantaneous &
costless
6. There is complete information
7. Firms are profit maximizing entrepreneurial
firms
*SUPPLY: a schedule of quantities of goods that
will
be offered to the market at various prices
PRICE TAKER--firm’s only decision is how much to
produce
given the mkt price. Since the firm is a profit maximizer it will
produce
the output that maximizes profit.
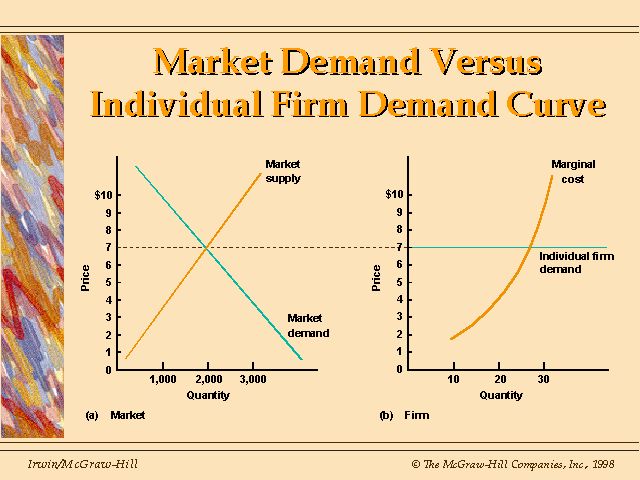
The FIRM’S SUPPLY CURVE will be its MC CURVE above its AVC CURVE
the firm perceives its demand curve as perfectly
elastic
If there is as increase in price, firms acting in their self-interest will produce more -- even though this collectively will force P down
=============================================
TERMS: MC & MR
Profit Maximizing Condition => P = MR = MC
in other output levels will yield lower profits
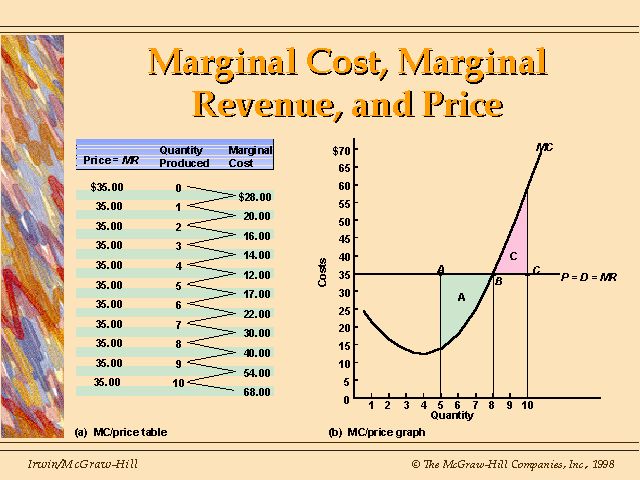
CALCULATE PROFIT: TR - TC = PROFIT
not necessary to know cost to determine the level of output that maximizes profit
=============================================
ACCOUNTING PROFIT = TR - TC
ECONOMIC PROFIT = TR - (TC + implicit opportunity costs)
opportunity costs => owner’s salary
normal profit - return on owner’s capital
=> not concerned w/
profit
per unit but maximizing total profit
DETERMINE PROFIT FROM A GRAPH
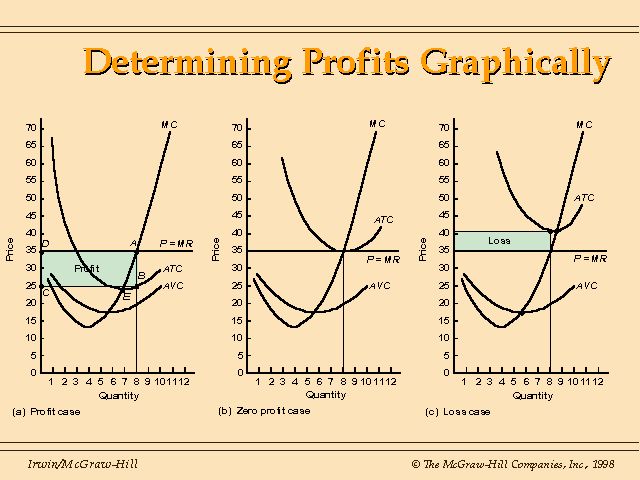
LR & SR CONDITION IN PERFECT COMPETITION
SR => zero, negative
or positive
LR => zero only

=> determining profit f/ TR
&
TC curves

=> shutdown point :
the
firm must pay FC whether it is operating or not -- the firm closes down
if it is losing more than FC, because its cheaper to go out of business

SUPPLY CURVES
anythe Market supply curve is the horizontal sum of each firm’s MC curve
as we sum the MC curves the Mkt supply curve
becomes
more elastic
The Mkt supply curve is more responsive, in terms of Qs, to changes in price than the firm’s supply curve (MC curve)
WHY?
1. Increase/decrease in Qs by existing firms
2. Entry/exit of firms in the industry
=> Mkt response to an
increase in
demand

=> MKT. RESPONSE TO A
DECREASE IN
DEMAND

* TWO REASONS TO STUDY PERFECT COMPETITION:
1. Understand how the invisible hand works
2. As a benchmark to judge other systems
the Pure Theory of Monopoly assumes that there is only one firm that represents the entire industry & sells a product
with no close substitutes -- in reality firms
can
have local monopolies even if they are in competitive industries
Microsoft is not a Pure Monopoly,
but Microsoft has Market Power
Therefore, just as the market demand curve in
perfect
competition is downward sloping so is the monopolist’s, they both
represent
the entire industry
HOW ARE MONOPOLIES CREATED?
Barriers to competition
1. Legal or Political=> patents (Xerox)
2. Sociological=> ethnic bias (Jameson)
3. Unique ability=> (Microsoft & Intel)
Perfect Competition=> firm is a price taker,
the firm’s
output does not affect price
Monopoly=> firm is a price setter, it chooses
the output
level it wants to sell & that level of output affects price
SO THE MONOPOLIST TAKES THIS INTO ACCOUNT WHEN
DETERMINING
PRICE & OUTPUT DECISIONS
the competitive firm benefits consumers & the
monopolist
benefit themselves
POLAROID vs. KODAK
Perfect Competition => P = MR
where, MR = change in TR / change in Q
Monopoly => MR is NOT equal to P /
except for
the first unit of output
MICHAEL JACKSON vs. MADONNA
Monopoly & Profit Maximizing Output => MR
= MC
Monopoly Graphically

MC curve same as perfect competition, but, it is
not
a Supply Curve, the Monopolist does not have a Supply Curve
Profit & the Monopolist
MR > MC increase profits by increasing Q
MR < MC increase profits by decreasing Q
MR = MC profit Max

NEGATIVE ECONOMIC PROFITS FOR THE MONOPOLIST

MONOPOLIST @ ZERO ECONOMIC PROFIT vs. PERFECTLY
COMPETITIVE FIRM IN THE LONG RUN

NOTICE: PERFECT
COMPETITION IN THE LR PRODUCES AT THE
LOWEST ATC vs. THE MONOPOLIST THAT PRODUCES
@ A HIGHER ATC
**************************************************************
THE NORMAL MONOPOLIST vs.
THE PRICE-DISCRIMINATING MONOPOLIST
the PRICE-DISCRIMINATING MONOPOLIST charges
the
highest price each consumer is willing to pay


NO CONSUMER SURPLUS
output is the same as perfect competition, but on
average,
charges a higher price
***************************************************
NATURAL MONOPOLIES=> economies of scale
***************************************************
WELFARE LOSS FROM MONOPOLY
the public generally despises monopolies,
because
of excessive profits. Economists believe that excessive profits aren’t
the problem -- welfare loss is the difficulty.
WHY? Resources are allocated inefficiently=> consumers buy less of the monopolist’s output & more of something else, relative to perfect competition.

***************************************************
PUBLIC-CHOICE ECONOMISTS => realistic critique of monopoly
Government created monopolies cause economic agent to lobby government for "monopoly rights"
RENT-SEEKING BEHAVIOR=>

rent-seeking loss=> Tullock Rectangle
Recommendation: Bid for monopoly rights

the expectation of guaranteed profits
encourages
firms to bid away profits=> so the granted monopoly will come close
to
zero economic profit & the government will receive the benefit, in
terms of increased revenue
******************************************************************************************
Chapter 14
MONOPOLISTIC
COMPETITION,
OLIGOPOLY &
STRATEGIC PRICING
we have studied the extremes of market structure
now we will look at two market structures that
are
closer to reality=>
MONOPOLISTIC COMPETITION
&
OLIGOPOLY
***************************************************
Market Structures are based on the physical characteristics of the market where they interact
***************************************************
CLASSIFYING INDUSTRIES: a way to identify market
structure
Standard Industrial Code (SIC): system of classifying mkts
Two Digit: broadly defined (general), more competitive
*furniture & fixtures SIC => 22
Four Digit: specific type (subset) of industry within the broadly defined grouping
*steel office furniture SIC
=> 2242
42 = steel office furniture
a subset of furniture & fixtures
MEASURING MARKET STRUCTURE
Concentration Ratio: the percent of industry
output
(market share) that the top firms have
Most Common Concentration Ratio: four-firm concentration ratio
below 40% => Monopolistic Competition
40% - 60% => Oligopolistic
above 60% => Monopolistic
PROBLEM WITH CONCENTRATION RATIO
does not tell the whole story=> one
firm
could have 48% & the next three firms could have 1% each
HERFINDAHL INDEX: measure of competitiveness of an industry
the market share of all
firms within an industry squared
For Example: 10 firms with a market share of 10% each
102 + 102 +...+ 102 = 1,000
ADVANTAGES:
1. Includes all firms in the industry
2. Gives extra weight to firms with a large
market
share
Rule of Thumb used by the
Antitrust
Division of the Justice Department=> mergers ok if less than 1,000
TWO EXAMPLES vs. CONCENTRATION RATIO
each example will have a four-firm
concentration
ratio of 51% but a much different showing in the Herfindahl Index
Ex. #1: 1 firm mkt share = 48%, next 3 = 1% each
four-firm concentration
ratio
= 51%
Let’s say the remaining 49%
mkt
share is shared equally by 49 firms, so they would each have 1% each
herfindahl index: 482 + 12
+...+ 12 = 2304 + 52 = 2356
Ex. #2: 3 firms with 13% mkt share & 1 firm with 12%
four-firm concentration
ratio:
51%
Let’s say the remaining 49%
mkt
share is shared equally by 49 firms, so they would each have 1% each
herfindahl index: ( 3 x 132 )+ 122 + ( 49 x 12 ) =
( 3 x 169 ) + 144 + ( 49 x 1 ) =
507 + 144 + 49 = 700
*neither index can identify the mkt power of conglomerates

***************************************************
Monopolistic Competition:
1. Many sellers (competitive aspect) e.g. restaurants
collusion is difficult -- firms are independent
2. Product Differentiation (monopolistic aspect)
Soft drinks & tacos / advertising the difference
shifts the demand curve to the right, higher price
3. Multiple Dimensions of Competition: in perfect competition the only dimension is price
a. Perceived quality, service & location
b. Ease of entry by new firms in the LR
c. No significant barriers to entry
d. Zero economic profits in
the
LR
Monopolistic Competition
has
some
monopoly power so it faces a downward sloping demand curve (its portion
of the market demand curve)
Price, Output & Profit Max is the same as
Monopoly

Comparing Monopolistic Competition with Perfect
Competition
Graphically this would
be the same as comparing monopoly with perfect competition
perfect competition produces @ P=MR=MC, @ min ATC
monopolistic competition: P=ATC >
MC=MR,
where ATC is not @ a min
THEREFORE, increasing output will lower ATC for a
monopolistic
competitive firm
ADVERTISING & ECONOMIES OF SCALE

advertising shifts up the ATC curve, but if the
firm
can increase output enough, then ATC are lower
***************************************************
Edward Chamberlin=> Monopolistic Competition
Joan Robinson=> Imperfect Competition
***************************************************
Monopolistic Competition & Oligopoly
ECONOMIC THEORY CAN PREDICT PRICE, OUTPUT &
LR
PROFIT FOR MONOPOLISTIC COMPETITION, BUT NOT FOR OLIGOPOLY
WHY?
Monopolistic Competition has many sellers & the firms do not consider the response of rival firms in their decision making process
&
Oligopolistic firms are few and they consider the
response
of their rivals in their decision making -- so it is hard to predict!
STRATEGIC DECISION MAKING: taking explicit account of a rival’s expected response
***************************************************
OLIGOPOLY:
1. Small number of firms
2. Mutually Interdependent
*Must use strategic decision making to survive
NO SINGLE MODEL OF OLIGOPOLY
many possible output & pricing strategies
economists have developed 5 of 6 models of
oligopolistic
behavior -- we will study the two extremes
CARTEL MODEL: firms
(oligopolists)
act like a single firm, a monopoly
*firms are assigned quotas consistent w/ p maximization
*uniform pricing
ÄExplicit
collusion
is illegal in the U.S.
ÄInformal or implicit collusion is hard to prove
Leadership pricing
Problem with the Cartel Model: firms’ interests may not coincide
Prices tend to be sticky (Keynes)
1. Collusion
2. Expectations of other firms’ reactions
CONTESTABLE MARKET MODEL:
barriers to entry determine price/output decisions
high barriers=> acts like a monopolist
low barriers=> acts more competitive
Price Warsè strategic pricing gone wild
Prices<ATC=>losses
THE JAPANESE & GLOBAL DOMINATION
Game Theory=> The Prisioner’s Dilemma
choices: No one confesses -- each gets 6 months
One confesses -- the other gets 10 years
Both confess -- they each get 5 years