
INTRODUCTION
The Economy: is the institutional structure whereby individuals in society coordinate their wants & desires
Economics: is the study of the economy
1. How people go about making a living
2. How scarce resources are allocated
Every Society faces THREE
central coordination problems:
1. What
to
produce & how much
2. How
to produce it
3. For
whom to produce it
**********************************************
The Basic Economic Problem=> Scarcity
Scarce
resources & unlimited wants/desires
Capitalism allocates resources by a
pricing
mechanism
SCARCITY FORCES US TO MAKE CHOICES
SOCIETY GENERALLY PREFERS MORE TO LESS
The Amish at Nordstrom’s?
Who has done more for society – Mother Teresa or
Bill Gates? It depends on what "more"
means?
If it
means spiritual, then Mother Teresa has done more.
If it refers to material well being then Mr. Gates has
more.
Ä
the amount of resources depends on human ingenuity — technological innovation
Four Main Resources (inputs): Factors
of
Production
1. Land
2. Labor
3. Kapital
4. Entreprenuership
**********************************************
Adam Smith’s Invisible Hand
works when there is prices that send signals
referred to as the pricing mechanism
according to Smith the exercise of individual self- interest benefits society
CONSUMER SOVEREIGNTY: power to decide what is/is not produced
Theories -- Models – over simplifications /abstractions => putting theory in a contextual setting
CETERIS PARIBUS: everything else being equal
The Circular Flow Model of Goods & Services
Micro vs. Macro
ECONOMIC
ANALYSIS
Positive
vs.
Normative
objective
vs.
subjective
empirical
vs.
value judgement
The Art of Economics=> Integrating positive & normative
What do economists know? UNCERTAINTY -- things change!
***********************************************************************************************
PRODUCTION
POSSIBILIES
& OPPORTUNTIY COSTS
OPPORTUNITY COST:
The
quantity of a good that must be given up in
order to obtain a good
The foregone value of the nest best alternative
Opportunity Costs can be seen numerically by way of a:
PRODUCTION POSSIBILITY TABLE
like an input/output table
Opportunity Costs can be seen graphically by way of a:
PRODUCTION POSSIBILITY CURVE
The table & the curve will show
different
combinations of output society can choose from. When society wants more
of one item then it must give up some of another item.
ASSUMPTIONS:
1. Full employment of all resources (in this case labor)
2. The level of technology is constant
3. Resources are interchangeable w/out inefficiency
4. Society prefers more to less
5. Society produces only tacos & tequila/no
trade
hrs. Labor Tacos hrs. Labor Tequila
20 200 0 0
15 150 5 15
10 100 10 30
5 50 15 45
0 0 20 60
Opportunity Cost of tacos for tequila
50 tacos/15 tequila (3.33 tacos for 1 tequila)
* if society wants tacos it must give up tequila -- just reverse the numbers
NEGATIVE SLOPE
* There is an inverse relation: to get more of one thing
you must give up something else
CONSTANT COSTS: all along the graph the opportunity cost is the same 50/15. This is represented graphically by a straight line PPC
Now, we will drop the assumption that resources are interchangeable, because some resources are better suited for the production of one good than another
COMPARATIVE ADVANTAGE (narrowly defined): To be better suited for the production one good than the production of another
Basketball Players & Jockeys
&
World’s fastest typist
Production Possibilities Table
Point
Missiles
Big Macs
A
3
0
B 2 10 billion
C 1 14 billion
D 0 15 billion
This implies... The Law of Increasing Costs, or,
The Law of Increasing Marginal Opportunity Cost:
to get more of something you have to give up ever increasing quantities of something else
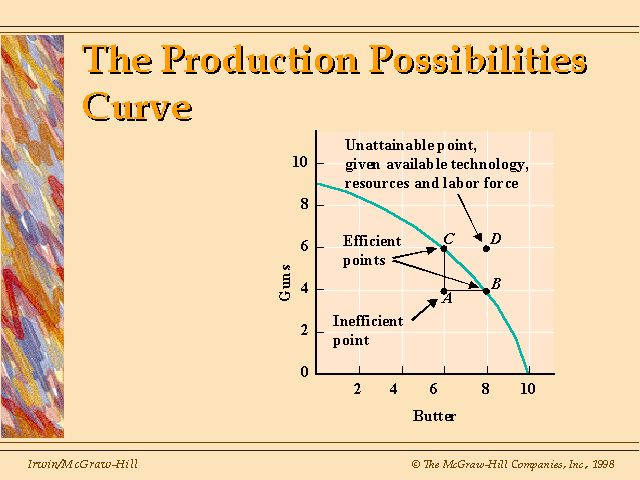
Efficiency: achieving a goal as cheaply as possible
Productive Efficiency: getting the most output from the fewest possible inputs
Inefficiency &
Unattainable
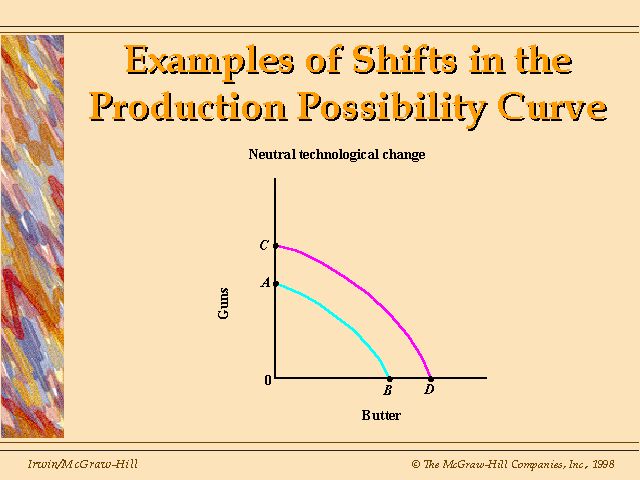
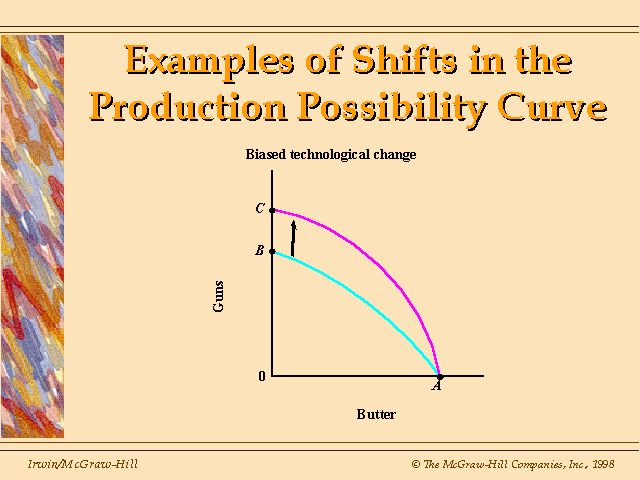
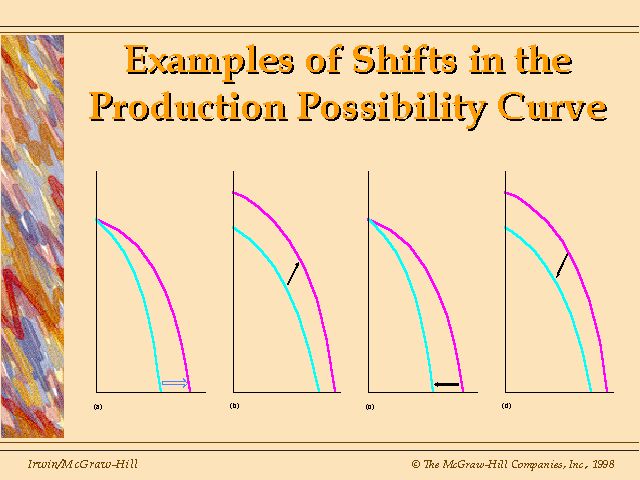
Shifts in the PPC
1. Technology improves
2. Resources discovered/destroyed (Kobe)
3. Efficiency of economic institutions
4. Population / workforce
************************************************************************************
Chapter 3
DEMAND AND SUPPLY
Some economists never leave this model
LAW OF DEMAND: More quantity of a good will be demanded the lower its price, other things held constant.
OTHER THINGS HELD CONSTANT
(Ceteris Paribus)
or...
Less quantity of a good will be demanded the higher its price, other things equal
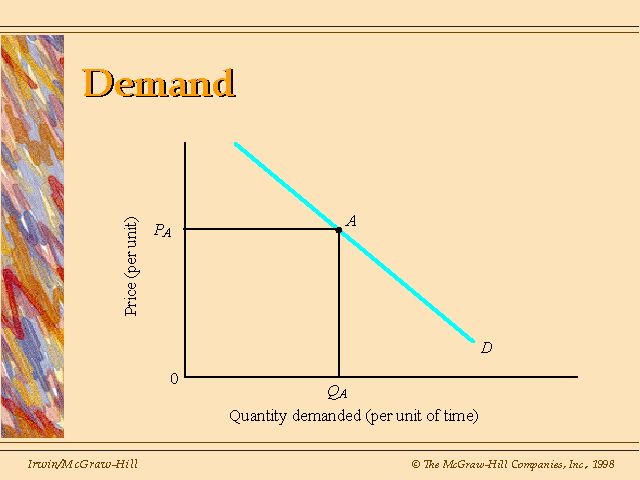
PROBLEM: Why does the demand for cars go up every
year along with increases in P?
Law of Demand Based on SUBSTITUTION
RELATIVE vs. MONEY PRICE (nominal price)
Example=> CPI 10%, wages 10%
BUT, Jumbo Jacks
only
5%
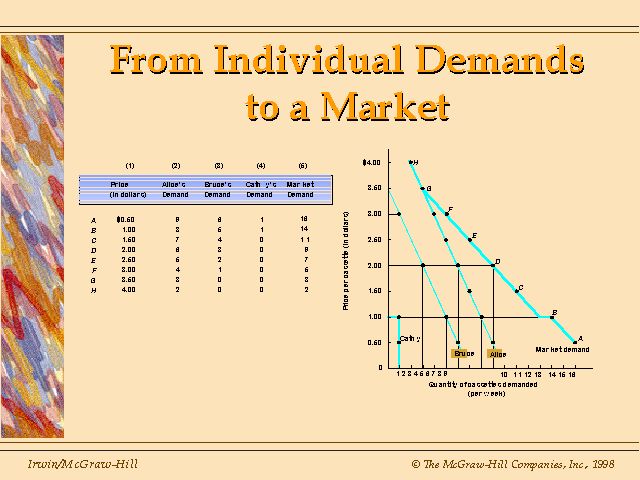
THE DEMAND SCHEDULE (table)
individual demand curves to market demand curve
Or, Market Demand Curves are the sum of
Individual
Demand Curves
QUANTITY DEMANDED (Qd): Q of a good that will be bought @ a specific P, other things constant
Ä Represented by a point on demand curve
A certain P & Qd combination
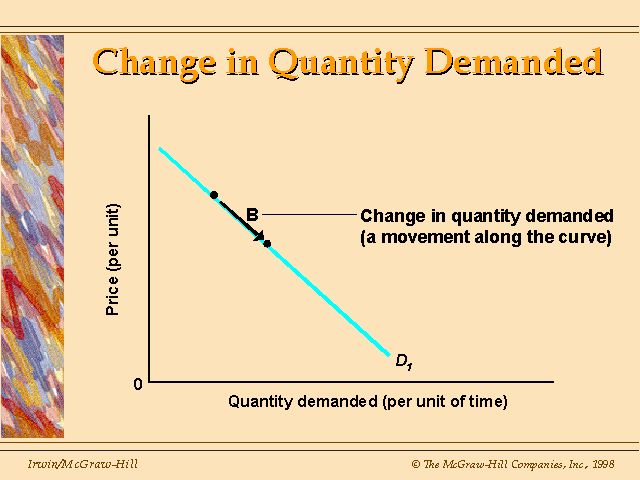
D in P causes a D in Qd = a movement along the demand curve
*Q/per unit of time
P & Q interact while other variables ceteris paribus
Partial vs. General Equilibrium
static vs. dynamic
ENDOGENOUS vs. EXOGENOUS
DEMAND: Quantities of a good that will be bought @ various prices, other things constant
Ä The entire
demand
curve
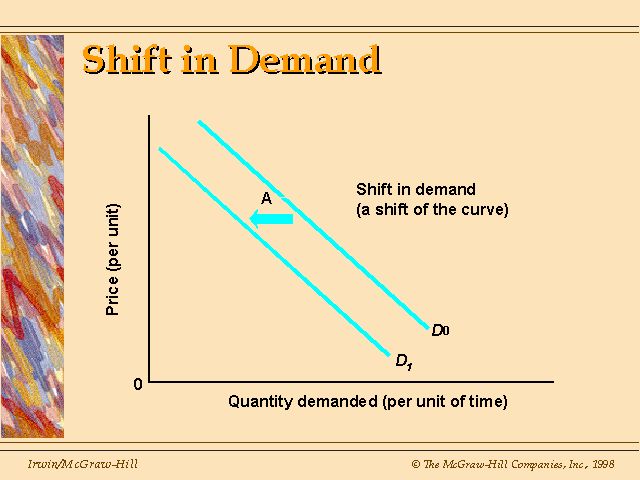
®If any
variable
held constant were allowed to D this would
shift
the entire demand curve
Shift Factors 1. Society’s income (population)
of Demand 2. Prices of other goods
3. Tastes & Preferences
4. Expectations
SHIFT FACTOR: something other than price that affects how much a good is demanded
**********************************************
SUPPLY CURVE:
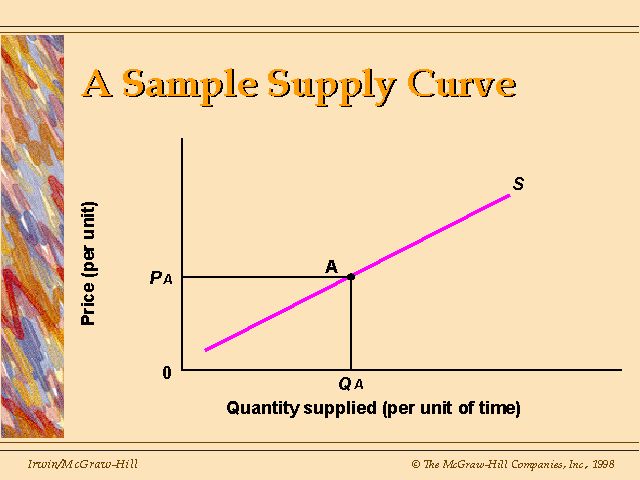
Law of Supply: Quantity supplied (Qs) of a good is directly related to the good’s price, ceteris paribus
P Qs or, P¯ Qs¯
*if price should fall firms could switch production to a higher priced good
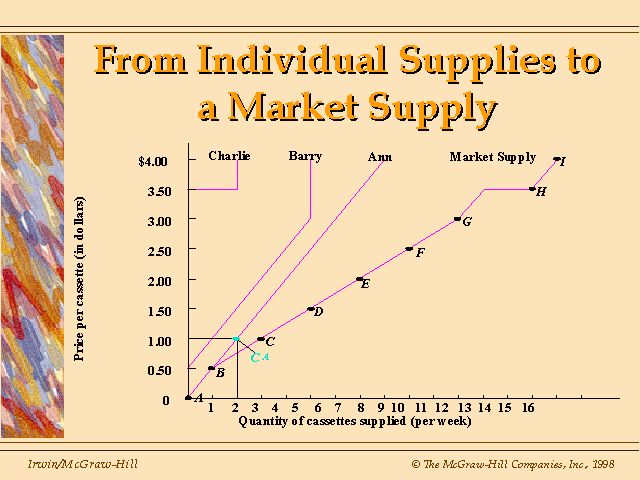
SUPPLY SCHEDULE (table)
The sum of the individual firm's supply curves
makes
the Market
Supply Curve
Quantity Supplied: a specific P & Qs combination, represented by a point on the supply curve
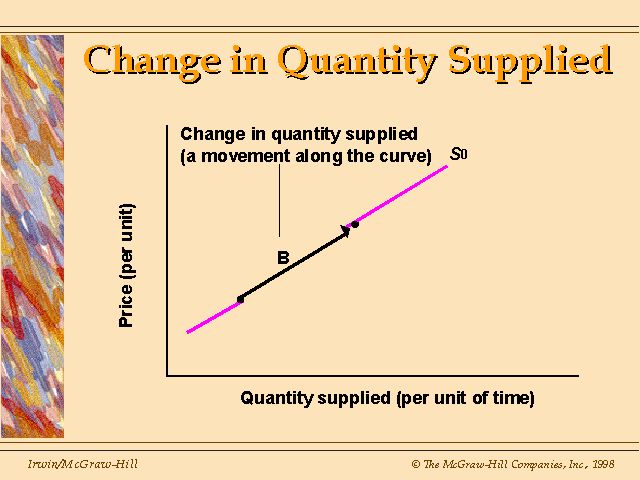
Supply: Q that will be brought to the mkt @ various prices *represented by the entire supply curve
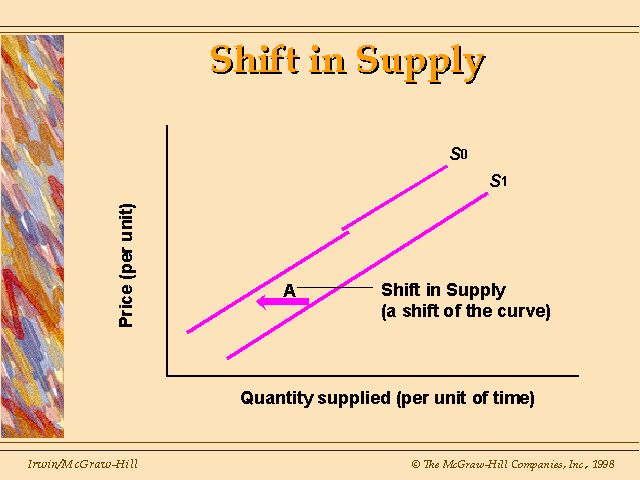
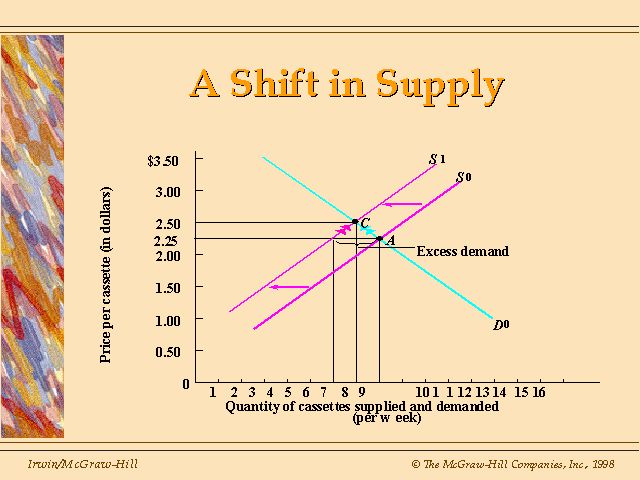
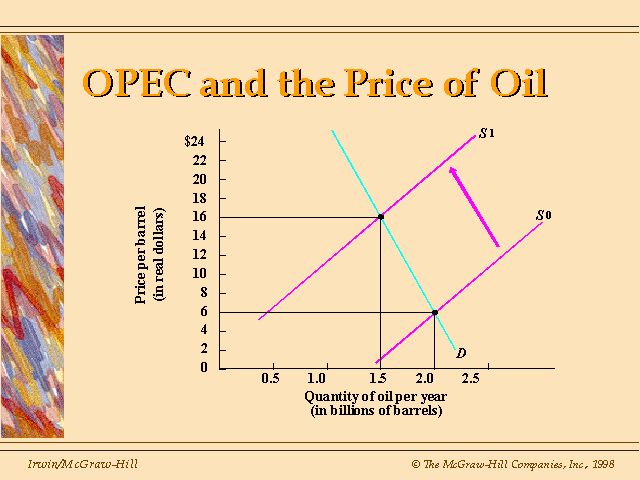
Shift Factors 1. Ds in the price of inputs
of Supply 2. Ds in technology
3. Ds in supplier’s expectations
4. Ds in taxes or subsidies
P Ds => DQs: movement along the supply curve
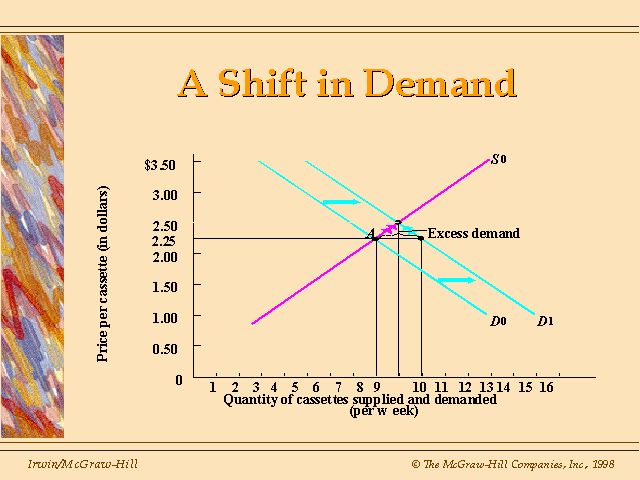
D shift factor
=>
D
Supply: Supply curve shifts
*******************************************************************************
Chapter 4
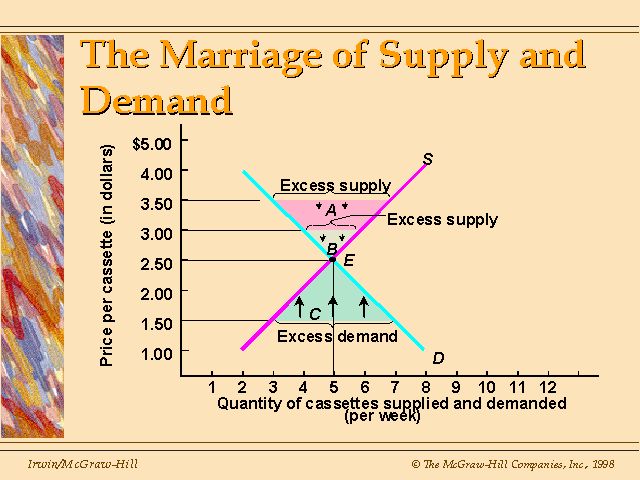
1st DYNAMIC LAW OF SUPPLY & DEMAND
Qs > Qd => excess supply => P¯
Qs < Qd => excess demand => P
2nd DYNAMIC LAW OF SUPPLY & DEMAND
the greater the difference between Qd & Qs
the
greater the pressure for price to D
3rd DYNAMIC LAW OF SUPPLY & DEMAND
where S=D, Equilibrium, no tendency for P to D
Ädisequilibrium
Price Ceilings & Price Floors
***********************************************************
BUSINESS OWNERSHIP &
ORGANIZATION
Business TypesÞ
advantages
& disadvantages
NUMBERS SALES
Sole proprietorships 69% 5%
Partnerships 8% 5%
Corporations
23%
90%
Where do households get incomeÞ about 70% comes from wages
*************************************************************
Chapter 15
EXTERNALITIES, MARKET
FAILURE
& PUBLIC CHOICE
EXTERNALITY:
An
effect on a third party resulting from a transaction between two
principals,
or, a third party effecting the transaction between two principals.
FREE RIDER: A
person
who participates in something for free because others have paid for it.
PUBLIC GOODS vs. PRIVATE
GOODS
*****************************************************************
Chapter 17 (pp 378 -
379)
TYPES OF TAXES:
Progressive
Regressive
Proportional
******************************************************************
Chapter 18
INTERNATIONAL TRADE
WHY TRADE? => its benefits are all around us
Caviar, Coffee & Mangos
WORLD TRADE in 1980 dollars
1928 $245b
1935 $123b
1950 $86b
1990 $2t
***************************************************
ABSOLUTE ADVANTAGE: producing a level of output using less resources than the competition=> A. Smith
=> specialization
What if a country doesn’t have an absolute
advantage?
Does it pay for a country to trade with another
country
if it has an absolute advantage in all production compared to the other
country?
COMPARATIVE ADVANTAGE:
If production costs (opportunity costs) differ then there are gains
from
trade even if a country has an absolute advantage in producing
everything.
=> David Ricardo
U. S. Japan
Hamburgers 20 200
Samurai Swords 5 100
*assume they each use an equal amount of
inputs
to get the unequal output above
*Japan has an absolute advantage in the production of both goods => Does it pay to trade?
***************************************************
U.S. PRODUCTION POSSIBILITY TABLE
hamburgers samurai swords
20 0
16 1
12 2
8 3
4 4
0
5
Japan’s PRODUCTION POSSIBILITY TABLE
hamburgers samurai swords
200 0
160 20
120 40
80 60
40 80
0
100
WHO GAINS FROM TRADE BETWEEN A SMALL
AND A LARGE COUNTRY? small country!
***************************************************
Tariff - tax
Quota - quantity limitation
Voluntary Restraint Agreement - self imposed limit
Embargo - political trade restriction
Regulatory Restriction/U.S. beef vs. Euro wine
***************************************************
REASONS FOR TRADE RESTRICTIONS
1. Unequal internal gains trade=> trade adjustment assistance
2. Haggling by companies
3. Haggling by countries over trade restrictions
4. Specialized production
learn by doing/economies of scale
infant industry argument
5. Macro aspects
6. National Security
7. International politics - embargo
8. Increased revenue f/ tariffs
***************************************************
REASONS ECONOMISTS SUPPORT FREE TRADE
1. Free trade increases total world output - restrictions can benefit a country as long as others don’t retaliate.
2. Restrictions reduce international competition
50s & 60s => U.S. protection of domestic steel
70s uncompetitive
80s asked for tax break to retool
U.S. Steel purchases Marathon Oil
**********************************************
Free Trade Associations=> EEC & NAFTA
GATT => WTO => MFN STATUS for members only