Amateurs and Hipparcos
By Eduardo Vila-Echagüe
New Age for Amateur
End of century technology has produced an incredible revival in amateur
astronomy. Deep sky photographs compare well with those taken in the great
observatories some decades ago, while present day amateur planetary images
have better resolution than what I can see in the books I still keep from
my youth. Even serious photometry is within its reach. The possibilities
of making some scientific contribution are no longer limited to variable
stars observing, comet hunting, meteorites or perhaps a lucky visual planetary
observation.
Yet there is another aspect of this technological revolution which I
think has not been stressed enough. It is related to the fact that today
we have almost immediate access to a big part of the data gathered by professional
observers, while at the same time we also have the communications, hardware
and software facilities to download, store and analyze selected portions
of those data. As an example of this, we can look at some HST images only
weeks after they are acquired, and at least in principle it is possible
that some of us could recognize in them something of value that had not
been perceived by the few professionals dedicated to them. After all, it
is not unusual that a second examination of old photographs brings out
discoveries which had been ignored by the original observers.
The beneficiaries of this new situation are, of course, armchair amateurs.
Not since the nineteenth century we have been in a better position to participate
in the development of our science. Of course not all fields are equally
suitable for us. We cannot even think of competing with professionals in
areas like cosmology, stellar models, spectroscopy or celestial mechanics.
Our knowledge of mathematics or physics is usually not deep enough. Instead,
we should focus in data transformation, analysis, display and interpretation,
by means of basic mathematics and the same statistics which many of us
are already using in our daily business. For instance, to display and recognize
the spongy distribution of galaxies in nearby space, including clusters,
voids and perhaps even bubbles, all that is needed is a sizable catalogue
of galaxies with some tens of thousands of positions and radial velocities,
a little knowledge of spherical trigonometry, a state of the art PC and
some practice with commercial spreadsheets.
Even in these areas we have disadvantages relative to professionals.
In the first place, it is almost impossible for us to have access to the
entire bibliography about the subject we have chosen for our research.
It is a little frustrating to think that you have found something new,
only to be told later that it was already discovered by some Russian or
Japanese scientist. Secondly, it is not easy to investigate any subject
without receiving feedback from your colleagues. Finally there is the difficulty
of finding a suitable place to publish the conclusions. Be it a local astronomy
magazine or perhaps a web site, what are the chances that professional
science will ever take notice of our efforts?
Our advantages, if any, are in our numbers, of course, but also in the
different approach to problem solving that we bring with us from our professional
activities. Everybody knows that customers are much more complex than stars.
Galactic research should not be more difficult than market research!
Hipparcos
What moved me to write these lines was the publication of the Hipparcos
star catalogue. It includes position, parallax and proper motion data for
nearly 120,000 stars, an order of magnitude more accurate than any previous
determination. And it is all packed on my Guide 6 CD which I bought for
a few dollars! All what I have to do is just select an area of the sky,
run the decompression program (included in the package) and load the data
into my favorite spreadsheet. Then I am ready to start plotting distances,
positions and velocities, looking for unusual patterns in the charts, filtering
the selected stars, computing averages and standard deviations, and finally
saving the spreadsheet to continue next day.
This is only the beginning. Soon I may be able to apply coordinate transformations,
adjust for solar motion, select special spectral types, compute absolute
magnitudes and plot Hertzsprung Russell diagrams, just the same kind of
things you see in the professional Journals, if you ever had one in your
hands.
What types of research can you perform on these data?
-
Compute the distance of the Hyades or any other nearby cluster, with better
accuracy than any previous work.
-
Discover new clusters by finding clumps in the five dimensional space formed
by the two positions and two proper motions in Right Ascension and Declination,
and by the parallax of each star.
-
See what field stars anywhere in the sky probably belong to the Hyades
moving group.
-
Compare cluster H-R diagrams with those of selected field stars.
Will you find anything new with these data, before the professionals do?
I am not sure, but you will have a lot of fun while trying.
In what follows I will present several examples of my own investigations.
Example 1: Distance of Cluster IC 2602
IC 2602 is an open cluster located in the southern constellation of Carina.
It has several naked eye stars, the brightest of which is the 3rd magnitude
star Theta Carinae. Its distance is stated as 150 pc in the Sky Catalogue
2000.0 and as 155 pc in the Guide 6 data sets.

The usual way to determine the distance of a distant cluster is to plot
the HR diagram, adjust it for interstellar extinction and reddening, and
then compare its Main Sequence with the standard Main Sequence known from
studies of nearby field stars or the Hyades cluster. The magnitude difference
for stars of the same color gives the so called Distance Modulus, which
in turn provides the distance. Unfortunately these distances are not very
accurate because the Main Sequence is not a line but a broad stripe, as
we will see later. With Hipparcos the situation has changed completely,
because it was able to measure the parallaxes of its individual stars with
an accuracy better than 10%, purely by geometric means. Let us then derive
a new and more accurate distance for this cluster as a whole.
Our first problem was to identify which stars belong to the cluster
and which are field stars in the same line of sight. The cluster's diameter
is stated as 50' of arc, but to be sure of not loosing anything I extracted
from the Catalogue all stars in a 3° × 3° field centered
on the cluster. I loaded the file, 49 stars in all, into my spreadsheet
and started the analysis. 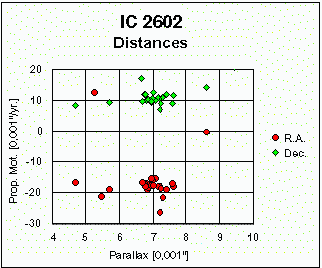 To see which stars were candidates for the cluster, I plotted an X-Y diagram
with the proper motions in R.A. and declination. In this chart it can be
seen at first glance a concentration of stars with proper motions between
-15 and -20 in R.A. and between 8 and 13 in declination. To verify that
all these stars are at about the same distance from us, I plotted both
proper motions against the parallax. This second chart shows that the cluster
stars have measured parallaxes between .0065" and .008". Based on this
analysis, a total of 17 Hipparcos stars belong to IC 2602. Applying standard
statistical formulae to these stars, we obtain a cluster parallax of 0.00706"
± 0.00007", corresponding to a distance of 141.6 parsecs with a
probable error of 1%. This is much better than the accuracy for which the
Hyades' distance was known a decade ago.
Example 2: Stellar Populations
According to textbooks, Population I is formed of young stars with high
metal content located in the disk of spiral galaxies, while Population
II are old stars with low metal content which are mainly to be found in
the galactic center or in a halo far from the galactic plane. But can we
recognize these same populations in our own surroundings?
In Hipparcos there is no information on star ages or metal content,
but we can differentiate the Populations in our neighborhood by measuring
their velocities relative to our local standard of rest. Population I should
move slowly to stay confined to the galactic plane, while Population II
should move much faster in order to get high into the halo or even to reach
the galactic center. Though radial velocities are generally unknown for
Hipparcos stars, we do have distances and transverse angular motions, the
product of which gives the velocity component at right angles to our line
of sight. These velocities must be corrected for the Sun's motion in space
and for galactic differential rotation; lots of trigonometric formulae
but nothing that is outside the reach of an amateur.
First I selected those stars with high quality parallaxes (arbitrarily
set at prob. error < 7%), 9869 stars in all, a size manageable with
a spreadsheet. Then I computed absolute magnitudes (Mv) and transverse
velocities, with the previously mentioned corrections. By selecting different
velocity ranges and plotting Mv versus color (B-V) we have the Herzprung-Russell
diagram for those subsets of stars. Of course total velocities are higher
than transverse velocities, because of the unknown radial velocity. As
a consequence, the only thing we can say for sure of these diagrams is
that there are no stars in it with total velocities smaller than the labeled
transverse velocity.
Some of these diagrams (with about 150 stars each) are shown on this
page. A clear evolution can be seen, especially when you look at the left
(bluest) and upper (brightest) ending of the diagonal stripe across the
diagram.
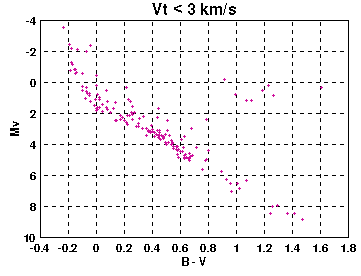
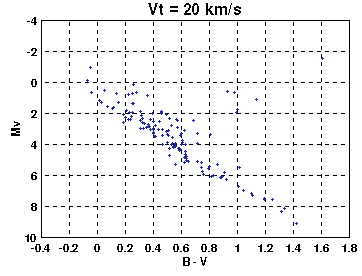

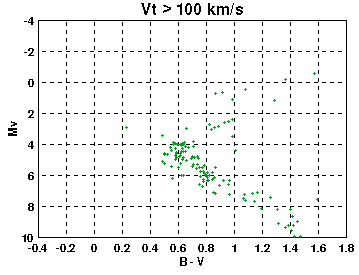
The series of charts show that the brightest of the slow moving stars
reach to Mv = -2 and B-V = -0.2, those that move at about our Sun's velocity
(20 km/s) get to Mv = +0.5 and B-V = 0.0, even faster moving stars (36
km/s) get to Mv = 2.5 and B-V = 0.3, and the fastest (>100 km/s) only reach
to Mv = 4 and B-V = 0.5. The fact that the Turning Point of each subset
of stars is so clearly defined, means that each group has a well determined
minimum age for its components, because all stars to the left of this Point
have already evolved to the end of their lives. The fact that the Turning
Point position is a continuos function of the transverse velocities implies
that we are not seeing separate discrete populations but just one single
population, with evolving parameters as a function of velocity.
It seems that the key point to establish is the reason for this velocity
distribution. Were the high speed stars born far from the galactic plane,
at a very early stage of galactic formation (like globular clusters), or
were they born with small velocities in the vicinity of the galactic plane,
to be later accelerated by some cumulative process, so that the older stars
move faster today? To answer this question it would help to know the minimum
age for the stars in each diagram.  This is a theoretical subject that of course is outside the scope of an
amateur study, but there is an indirect way in which we can estimate the
minimum ages as a function of transverse velocities.
This method is based on the comparison of these diagrams with those
for nearby open clusters. There is a close match between the Turning Point
of the Hyades, for example, and that of the stars with transverse velocities
around 28 km/s. As the age of the Hyades is estimated at 660 million years,
the 28 km/s group of stars should have this same age as its lower limit.
Repeating the process with different clusters we can estimate minimum ages
as a function of transverse velocities. Because of the qualitative nature
of the comparison, the fit is only approximate. The following table shows
the results for some clusters:
| Cluster Name |
Age[106 years] |
Vt [km/sec] |
| IC 2602 |
10
|
< 3
|
| IC 2391 |
36
|
4
|
| M45 (Pleiades) |
78
|
6
|
| M 7 |
220
|
10 ?
|
| Mel 111 (Coma) |
400
|
20
|
| M44 Praesepe |
660
|
22
|
The table does not contain older clusters because those do not have
stars bright enough to be included in Hipparcos data. It would be very
interesting to compare their HR diagrams, obtained from other sources,
with the fastest moving Hipparcos stars.
Example 3: New Cluster in Lupus?
As previously said, a new cluster will show itself as a clump in the five
dimensional space formed by the two positions and two proper motions in
Right Ascension and Declination, and by the parallax of each star. The
discovery process is much like what we did to identify the stars of IC
2602. The main differences are that we must search over a much larger area
of the sky and that the clumping of points in the different plots will
not be as obvious as in that example; otherwise those clusters would have
been discovered already. As it is not possible to visualize a five-dimensional
space, the best approach is to plot two dimensions while filtering (selecting
specific ranges) the other three. A reasonable choice is to plot Proper
Motions and Positions side by side. Filters should then be applied in a
way that they are visible together with the plots, so that the effect of
the changes can be seen immediately. An example is shown in the attached
figure.

The search proceeds by filtering narrow parallax ranges, until some
grouping is seen in one of the plots. Once that happens, the other plot
must be filtered to include only the stars of that grouping. If the second
plot also shows a grouping, we have discovered a clump in five-dimensional
space. This is what I did while investigating a 25° × 20°
area in the constellation of Lupus. After trying several parallax ranges,
I found that with 6 < Plx < 9, there was a clump in Proper Motions
at -25 < pmRA < -15 and -31 < pmDEC < 20. When filtering the
Positions plot with these ranges, a distinct group could be seen near RA
= 236° and DEC = -35°, with a diameter of about 3°. Nine Hipparcos
stars are probable members of this cluster (HIPP. 76395, 76945, 77038,
77135, 77150, 77286, 77315, 77317, 77713), the brightest of which is the
naked eye star Psi2 Lupi. The cluster parallax turns out to
be 0.00797" ± 0.00020", placing it at a distance of 128 parsecs.
Assuming that the stars' positions are distributed randomly in the area
under investigation, and considering the observed distribution of parallaxes
and proper motions, an average of 0.7 stars should have been found in the
five-dimensional volume where the cluster is. The fact that we have found
9 stars in the same area speaks in favor of it being a real cluster and
not a chance aggregation.
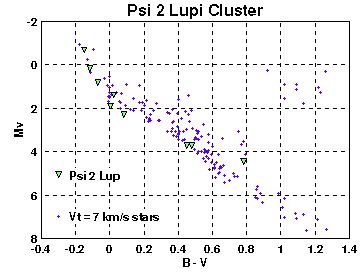
The accompanying HR diagram shows the stars of this group together with
those of the Vt=7 Km/s population. It seems to be a young cluster, resembling
IC 2391, which is about 40 million years old. Most of the stars in the
new cluster fit quite well in the Main Sequence, with the exception of
the faintest and reddest (HIPP. 77135), which may be an interloper.
Conclusion
I cannot estimate the scientific value of the foregoing examples, but I
am confident that they show a way for thousands of amateurs who are familiar
with personal computing to analyze Hipparcos data in ways that professionals
have neither the time nor inclination to pursue. We are seeing the birth
of a new era in which once again amateurs can play some significant role
in theoretical astronomy.
 To see which stars were candidates for the cluster, I plotted an X-Y diagram
with the proper motions in R.A. and declination. In this chart it can be
seen at first glance a concentration of stars with proper motions between
-15 and -20 in R.A. and between 8 and 13 in declination. To verify that
all these stars are at about the same distance from us, I plotted both
proper motions against the parallax. This second chart shows that the cluster
stars have measured parallaxes between .0065" and .008". Based on this
analysis, a total of 17 Hipparcos stars belong to IC 2602. Applying standard
statistical formulae to these stars, we obtain a cluster parallax of 0.00706"
± 0.00007", corresponding to a distance of 141.6 parsecs with a
probable error of 1%. This is much better than the accuracy for which the
Hyades' distance was known a decade ago.


 This is a theoretical subject that of course is outside the scope of an
amateur study, but there is an indirect way in which we can estimate the
minimum ages as a function of transverse velocities.

