Rainfall and Water Tanks
 Water Tanks
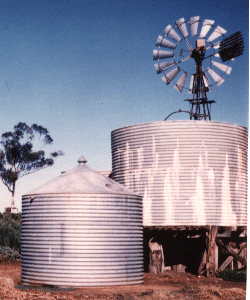
Our rainfall is an average of 300 mms (10 inches) a year, but it is very erratic, as shown by the chart below. We rely on water pumped from the irrigation channel into our supply of tanks. The taller tank, on the stand, gives us water pressure for our shower. Windmills were in use before electricity was connected to this area in 1951. They were easily damaged by severe winds, only worked in moderate breezes, and the clack (usually a leather seal in the lifting section) must be kept moist. The windmill is, in 1998, no longer a working model, being replaced by an electric pump that cost about 10% of the windmill price, is easier to prime, and is also low maintenance. In both cases, water needs to fill the inlet pipe before the mill or pump is started, so that the vacuum lift work of the pump can function. Water is lifted from the channel into the tanks. |
||||||||||||||||||||||||||||
| Click the photograph to return, or use the name to my Sultana Page. | ||||||||||||||||||||||||||||
| ||||||||||||||||||||||||||||
| Return to my Sultana Page. |