Intelligent Quality Function Deployment Method to Induce Indices of Four Persepectives of Balanced Score Card
Sang Chan Park, Ui Tak Yun, & Sung Min
Bae
Dept. of Industrial Engineering, KAIST,
373-1 Kusong-dong,
Yusong-gu, Taejon, Korea 305-701
Abstract
BSC(Balanced Score Card) measures performances of the organiztion with such four balanced perspectives as financial perspective, customer perspective, internal perspective, and growth perspective. So BSC is a set of comprehensive measurable indices which provide a framework of strategic measures for fulfiling strategic enterprise management (SEM). Though BSC is an effective tool for SEM, the detailed process of inducing indices for each persepective is concealed which makes it hard to apply in fields.
In this paper, we suggest an intelligent quality function deployment method for extracting BSC indices. More specifically, we will unfold it by selecting critical elements of Service Survey data using Factor Analysis and Partial Correaltion (indices for customer perspective). Next step is to find a potentially important set of quality characteristics to which satisfaction of target customer groups is ascribed, by applying machine learning modules such as Self Organizing Map and Inductive Classifiers (indices for internal perspective). The third step is to carry out loyalty analyses which distinguish the profitable-customer-group from the nonprofitable-one by using the same machine learning modules (indices for financial and growth perspective).
Keywords
21 Market Analysis and Applications, 3 Decision
Support Systems, 28 Neural Networks & Artificial
Intelligence
Today, to manage an organization is too complicated in complex and competitive environment like navigating and flying a jet airliner. Today’s managers recognize that their organization’s measurement system strongly affects the behavior of employees. Managers also understand that traditional financial accounting measures like ROI(Return On Investment) and EPS(Earning Per Share) can give misleading signals for continuous improvement and innovation – activities today’s competitive environment demands.
Effective measurement must be an integral part of the management process (Kaplan & Norton 1993). In this study, we suggest a method based on BSC which provides managers with a comprehensive framework that translates an organization’s strategic objectives into a coherent set of performance measures. The proposed method is used to accomplish the goal of an organization in four perspectives of BSC
BSC(Balanced Score Card)
BSC is a set of measures that gives top managers a fast but comprehensive view of the business. The balanced score card includes financial measures that tell the results of actions already taken. And it complements the financial measures with operational measures on customer satisfaction, internal processes, and the organization’s innovation activities – operational measures that are the drivers of future financial performance (Kaplan & Norton 1992). The balanced score card allows managers to look at the business from four important perspectives.
-
Customer perspective
-
Internal business perspective
-
Innovation and learning perspective
-
Financial perspective
Figure 2-1 shows a relation of the four perspectives of BSC.
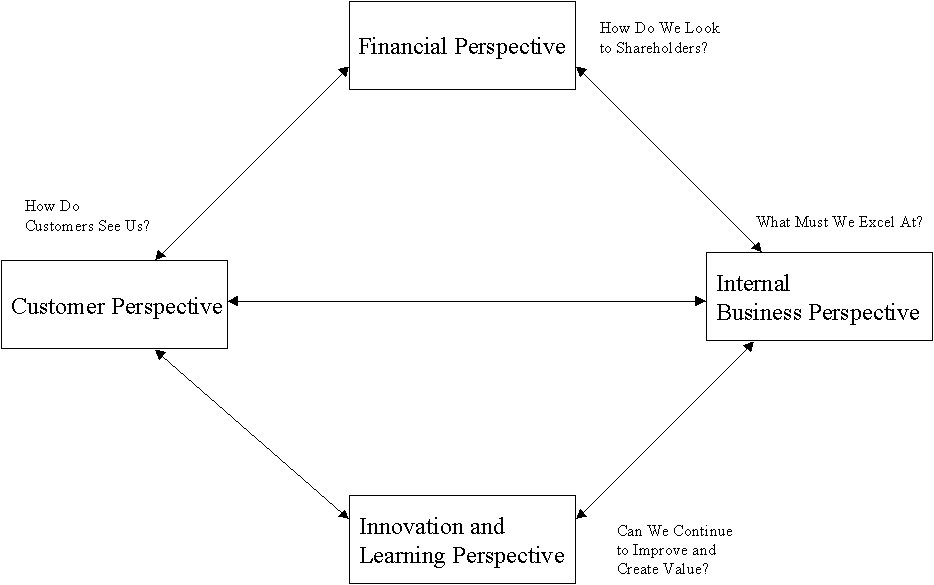
Figure 2-1. The relation of the four perspectives
While giving managers information from four different perspectives, the balanced score card minimizes information overload by limiting the number of measures used.
The strategy is a set of assumptions about cause and effect. The measurement system must be managed and justified by clarifying relationships between goals of variety of perspectives (Kaplan & Norton 1996). In this viewpoint, measures of BSC must be consistent and strengthen mutually.
The S optical instrument and camera company in Korea conducts several surveys to observe what customers want and strong or weak points for CS(Customer Satisfaction) strategy in comparison to competitors every year. CS is represented by the CSI(Customer Satisfaction Index). The CSI is an aggregated index of overall satisfaction, inclination of repurchase, inclination of recommendation to others.
In general, keeping customer is less expensive than recruiting new customers (Joiner & Deming 1994). If current profitable customers defect because of dissatisfaction, new customers must be recruited to maintain the profitability level which is costly and even without the guarantee of new ones being profitable. In this sense, the profitability in current time period as well as the potential profitability measured by the CS are of importance.
In this paper, we find the most affecting quality characteristics which contribute to the CS level of customers of CSI and then find the most potentially profitable target customers which will increase not only the financial measures but also operational measures.
Figure 3-1 exhibits a specific model that accomplish this goal. To carry out the project, we will apply to the existing CSI data and a customer DB in the exemplar organization. And in each system, FA(Factor Analysis), Cascade Correlation and ML(Machine Learning) modules such as SOM(Self Organizing Map) and C4.5 will be used to analyze customer and goal.
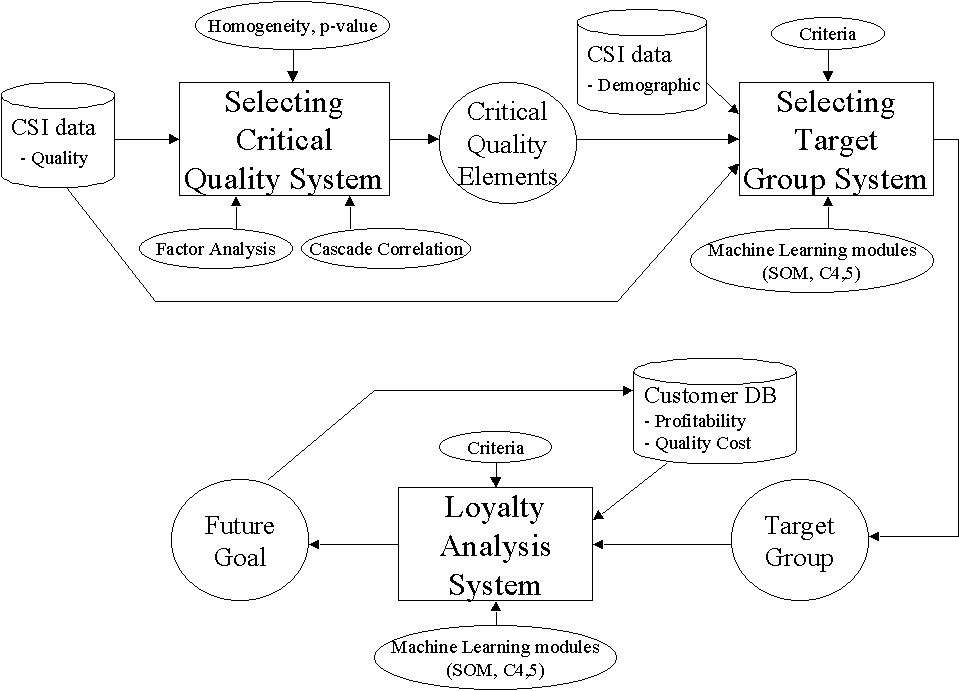
Figure 3-1. A model which exhibits research direction
In this section, we will show the results of applying three systems of the model in a camera industry. Before analyzing, first we see the present condition of a auto-zoom camera market and industry in Korea. For the past several years, the growth rate of the market slows down. Yet the internal structure of the market changes rapidly as the technology advances. The trend is characterized by the preferences to the smaller size, the variety of value added functions, custome-fit colors and design and link to PCs. With this trend, the camera industry are considered as a high value added industry. The CSI data are obtained from the 199X survey conducted by the face to face interview to 672 people.
Selecting Critical Quality System – Internal Business Perspective
We use the FA(Factor Analysis) for data reduction. In the CSI data, there are 20 questions which relate to quality. By applying FA, we have 4 components and table 4-1 shows these questions which represent each component.
|
Component |
|
|
1 |
Q11A2: zoom |
|
2 |
Q9E: shop atmosphere |
|
3 |
Q9D1: color |
|
4 |
Q11B: shutter. |
Table 4-1. The results of FA
The partial correlation procedure computes partial correlation coefficients that describe the linear relationship between two variables while controlling for the effects of one or more additional variables. With the 8 questions and overall satisfaction, we have the following result.
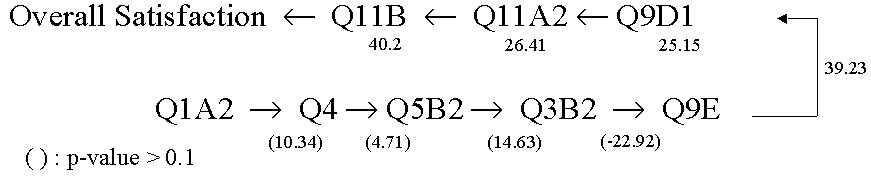
After performing the partial correlation, we may extract the most affecting four quality characteristics (Q11B, Q11A2, Q9D1, Q9E) which contribute to the overall satisfaction and have p-value less than 0.1.
Selecting Target Group System – Customer Perspective
The critical role of this module is to find some demographic features of a target group. First, we make a data file which consists of demographic data and overall satisfaction data and then train and predict the data file. Second, we select a target customer group which has highest average overall satisfaction. Third, we extract demographic features of customers which purely belong to the target group. Finally, we select customers which correspond to these demographic features from the pool of potential customers. In fulfilling these processes, we apply ML modules such as SOM and C4.5 repeatedly. Figure 4-2 shows a block diagram to accomplish these process.
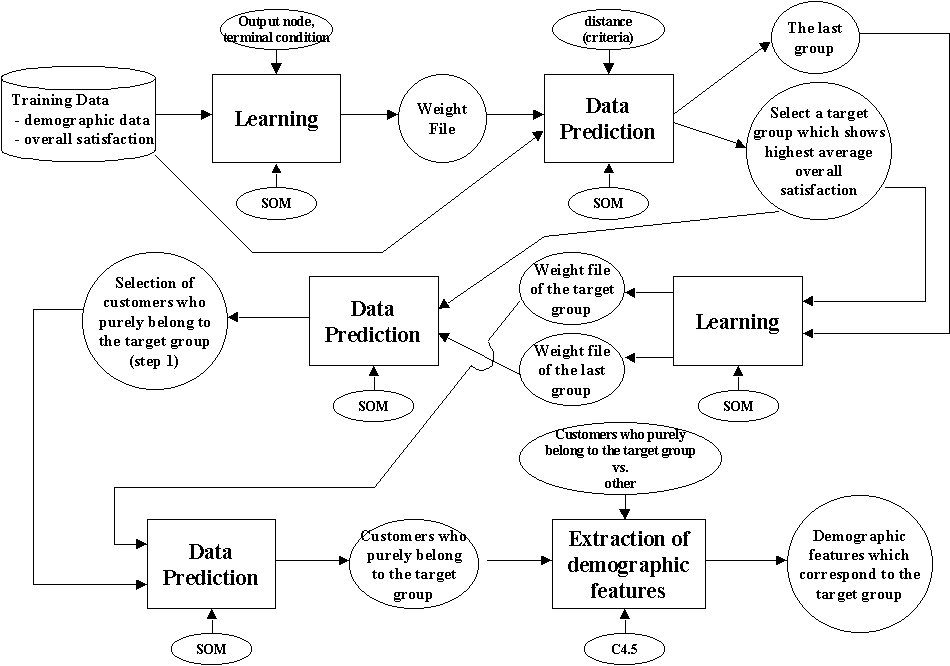
Figure 4-1 Block diagram for selecting target group system
After performing these processes, we have following results. First, we discriminate pure 18 customers in target group customers. Then, we extract demographic features of these 18 customers. Table 4-2 shows these demographic features.
|
description |
value |
|
Driver’s liscence |
possessed |
|
Education |
Bachelor or above |
|
Type of Living |
Residental house |
|
Occupation |
Not in the primary industry (i.e. agriculture, fishery, forestry) |
Table 4-2. Result of demographic features.
Loyalty Analysis System – Financial Perspective
In this module, we manage the loyal customer group which has high CS and high profitability and take some customers who have low CS but high profitability into the loyal customer group. We call this process loyalty analysis. And then, we establish future goal to accomplish utilizing the organization’s historical performances.
To do loyalty analysis, we divide customers of CSI into four parts using CS and profitability in customer DB. Figure 4-2 shows these four parts.

Figure 4-2. Define loyal group and potentially profitable group
Then, we extract some quality characteristics which distinguish loyal group from potentially profitable group by applying C4.5. Table 4-3 illustrates the corresponding process.
|
Importance |
Quality Characteristics |
|
1 |
Q9D1 |
|
2 |
Q11B |
|
3 |
Q9E |
|
4 |
Q11A2 |
Table 4-3. Quality characteristics which are improved
According to the results of loyalty analysis, we establish quality cost and set future goal in comparison to historical performances of the organization.
Figure 4-2 shows a future goal of profitability of 199X+1. Instead of suggesting a fixed goal, the ranges of goal are suggested against varying quality cost.

Figure 4-2 Establishing future goal
Innovation and Learning Perspective
In this project, we construct most of systems based on Web. So, web-based system provide managers and employees with accurate and important information about customer or internal business. And managers use these system as a decision support system providing flexible accesses.
In this study, an intelligent quality planning methods on quality function deployment to support BSC was discussed. First, we extracted quality characteristics which contribute to the overall satisfaction using FA and cascade correlation. Next, we selected a target group which had highest average overall satisfaction and found potential customers who correspond to the demographic features of the target group by applying SOM and C4.5. Finally, we did loyalty analysis and the established a goal of 199X based on comparison on historical performances of the organization using DEA.
By applying these methods, we expect following contributions. We exhibited a specific model based on BSC to increase operational measures which is not recognized well as opposed to the financial measures. And in application, we constructed a web-based system as a decision supports system providing flexible accesses.
Reference
- Joiner, B.L. and Deming, W.E. (1994), "Fourth Generation Management: The New Business Consciousness", McGraw-Hill, New York, New York.
- Kaplan, R.S. and Norton, D. P (1992), "The Balanced Scorecard – Measures That Drive Performance", HARVARD BUSINESS REVIEW, Jan-Feb
- Kaplan, R.S. and Norton, D. P (1993), "Putting the Balanced Scorecard to Work", HARVARD BUSINESS REVIEW, Sep-Oct.
- Kaplan, R.S. and Norton, D. P (1996), "Balanced Score Card", Harvard Business School Press.