Communicating and Controlling Strategy: A Study on the Effectiveness of
the Balanced Scorecard |
By Mary A. Malina and Frank H. Selto |
Part 3 of 4 |
Both distributors and DBSC
administrators perceive that the DBSC weights reflect the company's view of the most
important areas of performance. Additionally and with experience, the company revised the
weights to reflect learning about impacts, unreliability, or possible manipulation of some
of the softer measures. It is quite interesting to note that the company's first version
of the DBSC placed a total of 20 percent weighting on Investments in human capital
(learning and growth area), but within a year that weight had been reduced to currently
only 4 percent. Likewise, the first scorecard placed a 10 percent weighting on Corporate
citizenship (internal processes and customer value areas), now reduced to 4 percent. The
company redistributed the original weightings mostly to the traditional market share
measure (customer value area), which grew in importance from 12 percent to 28 percent. The
company also has added weight to diagnosing and solving customer problems (internal
processes area), which grew from 2 percent to 10 percent in importance.
Figure 1 shows a quarterly
DBSC, as reported to management for several representative distributors. This scorecard,
which is based on numerical measures, is notable for several reasons. First, each
distributor's quantified and internally benchmarked performance measure is labeled and
colored "red" for "fails to meet criteria for acceptability",
"yellow" for "meets criteria for acceptability", or "green"
for "exceeds criteria for acceptability." The total score in the last column is
computed by multiplying each measure's numerical score by the appropriate weights. Second,
each distributor obtains its own report and its relative, numerical ranking (e.g., 7th out
of 31). Furthermore, names of distributors that achieve "green" ratings are
posted on the company's intranet for all to see.

Figure 1 - Representative Distributor BSC Ratings and Scores
5. Research Method
This study investigates its research questions with qualitative, interview data obtained
from individuals directly involved with the company's DBSC. Thus, the evidence is
perceptual in nature and, while it ideally reflects the "reality" of the impact
of the DBSC, it also may reflect individuals' and researchers' biases in ways that are not
easily detectable. The study's research method attempted to mitigate the effects of these
unknown biases. The research method is described below.
Sampling
Because the DBSC represents such a dramatic change in measurement, strategy, and culture
for the company and its distributors, we sought and obtained direct commentary from two
designers, three managers who use it to evaluate distributors, and nine of the 31
distributors. Because we are interested in all facets of the DBSC, we limited the scope of
the distributor sample to those who consistently reported complete or nearly complete
data. This criterion may bias the analysis if distributors reporting more complete data
have systematically different perceptions than other distributors. Another source of bias
may be scorecard performance, which could influence perceptions of the DBSC, so we next
chose nine distributors who reflected overall red, yellow, and green ratings. Of the
distributors reporting complete data, only one "green" distributor was available
and three "red," so we filled out the sample with five "yellow"
distributors. The sample also reflected geographic dispersion - three western, two
midwestern, two southern, one northeastern US, and one Canadian distributor. After
analyzing the interviews, we feel confident that we have obtained a full range of
distributor responses. As the interviews proceeded, responses became repetitive. While
additional "green" distributor interviews would have been desirable, we feel
they would be unlikely to contribute additional insights.
Data
Collection
We obtained archival data (background and policy documents and quarterly DBSC scores) from
managers who administer the DBSC. All interview data were obtained via telephone after
sponsoring managers informed designers, other managers, and all 31 distributors that we
were conducting this study and may call them for input about the DBSC. Interviews lasted
from 45 minutes to 75 minutes, depending entirely on how much an interviewee had to say.
We used a semi-structured interview format and assured respondents of anonymity.
To avoid responses that could
be artifacts of the interview process itself, we deliberately did not ask leading
questions regarding management control or communication attributes of the DBSC. While the
study's use of management control and organizational communication theories represents a
deductive approach to research and does guide later analysis and model building, we were
not confident that we had identified all relevant factors related to the effectiveness of
the DBSC. At this stage, we preferred to gather data more freely and let the respondents'
natural, undirected commentary support, deny, or extend the theories. An important benefit
of this approach is that respondents may identify factors that affect the effectiveness of
the DBSC other than those anticipated by the study's theory.
In your own words, what is
the distributor-balanced scorecard?
What do you think the
objective of the balanced scorecard is?
What are the nine measures
that distributors report really measuring?
What are the measures that
are filled out by the company really measuring?
How do the measures that
distributors report relate to the company's measures? (Follow up: Do changes in
distributor performance cause changes in the company's measures?)
Do the measures
(distributors' and the company's) help you in any way? (Follow up: How?)
Are there any benefits from
the balanced scorecard itself? (Follow up: Apart from the individual measures?)
Do you have any (other)
recommendations for improving the balanced scorecard?
We asked essentially the same
questions of administrators of the DBSC, but their interviews tended to be more open and
wide-ranging. To keep within the time available, we usually did not ask the administrators
questions about specific DBSC measures (questions 3 and 4). Thus, distributor and
administrator interviews are not directly comparable on all questions. Because the
administrator interviews are less focused on the DBSC measures, we use them in this study
for background information. Unless otherwise indicated, the discussions that follow refer
to the distributor interviews only.
The interviews were conducted
via conference calls conducted over a three-week period, with one researcher asking
initial and follow-up questions and the second researcher taking notes and capturing the
commentary on a laptop computer. After each interview, the two researchers conferred
immediately to complete abbreviated comments that might be difficult to decipher later.
Interview files were copied intact and archived in several locations. Note that use of all
data collected for this study is regulated by a non-disclosure agreement, which requires
the researchers to protect the company's identity and to obtain approval to publish any
reports that might expose the company's proprietary information.
Coding Interview Data
Development of codes. The computerized analysis method applies codes that reflect
theoretical or empirical constructs to the qualitative data - a sophisticated way to
annotate and generalize interview transcripts. We predetermined codes for the interview
data to reflect the interview questions - questions 1, 2, 4 - 8 and twelve
distributor-supplied measure questions for question 3. We also created codes during the
analysis of interview data that reflect underlying concepts, many of which are expected
management control factors (e.g., Causality among measures) and attributes of
organizational communication (e.g., Supports company culture). However, a number of codes
reflect additional concepts, revealed in the coding process (e.g., Weight of each measure
in determining overall DBSC scores). This created a coding structure that permits nearly
unlimited analyses of management control and communication issues (e.g., within the
sample, within each respondent, and within each question). These codes were then overlaid
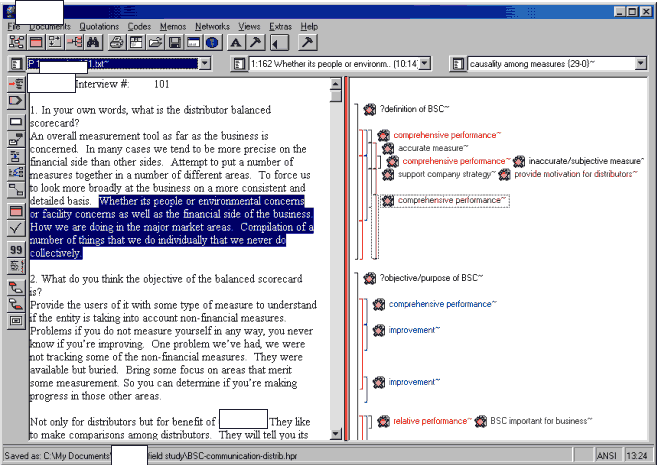
upon the interview data. Figure 2 shows an example of a section of coded interview text.
The software used, ATLAS.ti, permits even more extensive analyses, which we describe
later.

Figure 2 - Example of Coded
Interview Text
Coding procedures. After
agreeing upon the predetermined coding scheme, each of the two researchers coded the first
interview using the software tool. We did not use the software specifically to search for
or count specific words or phrases. Choice of vocabulary is arbitrary, and words or
phrases may not carry meaning outside of their spoken context [Miles and Huberman, 1994].
Analysis, therefore, required reading, understanding, and coding blocks of text in the
context of each interview. We developed additional codes as we analyzed the data to
reflect the nature of other comments made. Because some codes were created during
analysis, it is impossible to separate coding from analysis at a basic level. As explained
later, this approach has both advantages and disadvantages. After coding the first
interview, we met, computer files side by side, to compare our coding, resolve
differences, and agree on a refined set of codes. We resolved coding disagreements and
agreed on additional codes by mutual agreement. We then coded the remaining interviews,
and mutually resolved any disagreements. In some instances, the resolution was to revise
the name or definition of a code. A number of preset codes were not used and are not
reported.
Tests
for reliability. To test coding reliability, several weeks later each of the
researchers recoded one randomly selected interview. We then identified agreements and
disagreements between the first and second coding and each other's recoding. Note that the
software allows the researcher to code any portion of text - a single word, phrase,
sentence, paragraph, and so on. Therefore, we did not count minor differences in
boundaries of text blocks as disagreements; rather, a "disagreement" was a
different code (or no code) applied to roughly the same block of text. An
"agreement" was using the same code for approximately the same block of text.
Within-coder agreement for this test averaged 73 percent [agreements/(agreements +
disagreements)], and inter-coder agreement was 59 percent. These measures of coding
reliability were low compared to norms of 80 to 90 percent coding reliability [Miles and
Huberman, 1994, p. 64].
Achieving acceptable coding
reliability. We treated coding differences as quality defects, which we initially
attributed to two sources of coding variation. First, the baseline coding had been
accomplished jointly, which, because of the dialogue between the researchers, we believe
is more valid than individual coding. Individually, however, we could not reliably
replicate the joint effort. Clearly, reliability testing should simulate the jointly coded
sample interviews. Second, differences among a number of codes were too subtle to detect
during reliability testing. This indicated a need to trim the codes into a parsimonious
set, which we accomplished by collapsing closely related codes. The total number of codes
declined from 70 to 54. We then jointly applied the revised coding rules to the entire set
of interview data. This simplified the coding effort, which yielded increased reliability,
without, we believe, material loss of descriptive validity.
Testing these refinements by
re-coding three randomly selected interviews, we found acceptably higher agreement, which
averaged 80.3 percent (ranging from 69 percent to 87 percent across the three interviews),
which is (barely) within the desired range. We are confident that the revised coding, upon
which the rest of the analysis rests, is sufficiently reliable given the coding structure
and definitions, which are in an appendix to this paper.
The final list of codes, with
frequencies by interview, is in table 2. Observe that for ease of later exposition, we
have grouped a number of related codes into large-pattern codes or "supercodes."
These supercodes generally reflect ex ante theoretical constructs (e.g., Effective
communication, Effective management control), but the supercode, Positive outcomes,
represents ex post outcome factors that were salient in the qualitative analysis and that
we use as surrogates for quantifiable performance. The frequencies of the codes are an
indication of relative importance of each of these concepts, but frequency does not
reflect intensity of feelings, nor does it reflect relations among concepts. These
attributes of the data may be discovered through additional analyses.
 Table 2 - Interview Codes and
Frequencies by Interview
Next, we used the analytical
tools of the qualitative software to develop deeper understanding of the relations among
these data.
Relations
Among Codes
Theoretically supported model. The relational-query capabilities of qualitative
software permit extensive exploration of associations and possible causal hypotheses using
interviewees' perceptions of the DBSC. However, it is most efficient and realistic to
begin with the conceptual framework of management control and organizational communication
that motivated the research as an analysis guide. Recall that the initial framework,
described in sections 2 and 3, also includes "ineffective factors" resulting in
negative outcomes. Figure 3 is the expected model of relations among employees'
perceptions of the management control and organizational communication attributes of the
DBSC - based on the prior literature review and codes applied during analysis. The arrows
between the boxes reflect expectations about causal relations. We expected that both
Effective management control and Effective communication in the design and use of the DBSC
would cause Aligned with strategy, Effective motivation, and, ultimately, Positive
outcomes. In contrast, we expected that "ineffective" factors could cause
"negative" outcomes (in this case, only Conflict/tension was observed
qualitatively and coded).
![figure_3[1].gif (13413 bytes)](figure_3.gif)
Figure 3 - Expected Model of
Employees' DBSC Perceptions
Observing relations among
codes. Assessing the degree of relation among codes requires analysis of proximity and
context of hypothesized relations (as in figure 3). The qualitative software used easily
enables queries of proximity relations or associations among coded quotations:
Coded quotations of one type enclose
coded quotations of another type
Coded quotations of one type are
enclosed by coded quotations of another type
Coded quotations of one type overlap
coded quotations of another type
Coded quotations of one type are
overlapped by coded quotations of another type
Coded quotations of one type precede
coded quotations of another type by no more than one line
Coded quotations of one type follow
coded quotations of another type by no more than one line
Close proximity of types of
quotations may indicate either association or causality, so analysis of the context of
these measures of proximity is necessary. Miles and Huberman [1994, p. 146-7] argue that
qualitative analysis can assess causality in ways similar to quantitative analysis.
Investigating the context and meaning of associations in qualitative data may reveal
causality (say, between Effective management control - EMC - and Strategy alignment - SA)
by any of the following observations (the more the better), in rough order of
applicability to this study:
Specificity (a particular
link is shown between EMC and SA)
Consistency (EMC is found
with SA in different places)
Strength of association (much
more SA with EMC than with other possible causes)
Coherence (EMC-SA
relationship fits with what else we know about EMC and SA)
Plausibility (a known
mechanism exists to link EMC and SA)
Temporality (EMC before SA,
not the reverse)
Behavioral gradient (if more
EMC, then more SA)
Analogy (EMC and SA resemble
the well-established pattern in "C and D")
Experiment (change EMC,
observe what happens to SA)
The next section specifically
addresses how we operationalized the "more is better" approach to establishing
causality to investigate the study's research questions.
6. Results
It is clear that distributors are aware of and understand the purpose of the overall DBSC,
consistently with Kaplan and Norton's rationale for the BSC. Representative comments that
explain their awareness of the new measures and their linkages include:
"A lot of businesses tend
to run with financial and market share measures, but those are pretty crude handles. We
have to get underneath with measures like quality and cycle time, and softer things like
employee development. That's where the leverage of the business is. The others are results
of what you've done" [3:154-158]. "I think they are all linked. It's hard to be
a good manager in one area and not another" [9:118-119].
The objective of this study is
to find whether awareness of the attributes of the DBSC is causally related to reported
process or decision changes (i.e., research questions 1 and 2). Qualitative database
software, such as Atlas.ti, is specifically designed to enable this analysis. Table 3
displays the results of applying the software query tool to all possible pairs of codes
from figure 3. Using supercode-level queries reduced the number of specific search
combinations dramatically. Note that queries will find every association of the elements
of supercodes, not all of which may be evidence of association or causality. To focus the
investigation on consistent linkages, we identified all supercode links with a total of
ten or more "hits" or observed associations, and looked for concentrated
evidence of causality between individually coded comments. In some cases, the total number
of hits linking two supercodes was widely diffused across their elements, with no
consistent patterns at the individual code level. We did not investigate these diffused
associations further. That is, we conservatively treated consistent, strong (i.e.,
numerous) relations of specific factors as necessary for establishing causation.

Table 3 - Analysis of
Distributor-Response Supercode Proximity
Where we found consistent,
strong (frequent), specific patterns of association we looked for further evidence of
causality, based on coherence, which is closely related to face validity. This
"story" of coherent causality is what distinguishes between our findings of
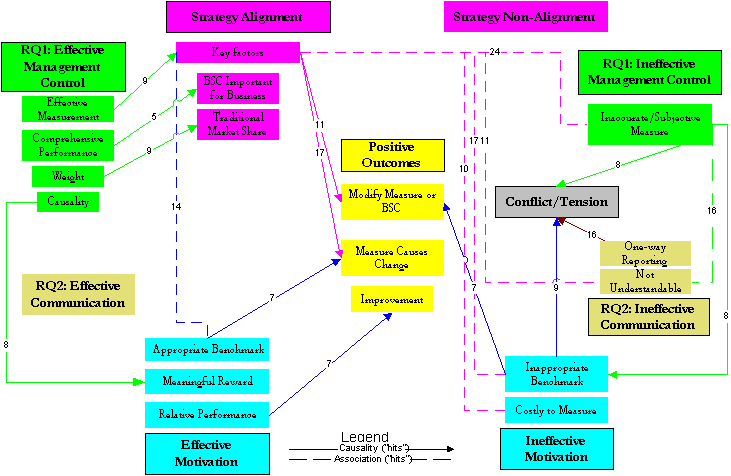
causality or association. The result of this detailed investigation is reflected in figure
4.

Figure
4 - Data-Supported Model of Distributors' BSC Perceptions
This ends Part 3 of 4


![figure_3[1].gif (13413 bytes)](figure_3.gif)
