Communicating and Controlling Strategy: A Study on the Effectiveness of
the Balanced Scorecard |
By Mary A. Malina and Frank H. Selto |
Part 4 of 4 |
OVERVIEW OF DATA-SUPPORTED
MODEL
Empirically associated quotations in the interview data, which are reflected by linkages
in figure 4, support the research questions in interesting ways. (Numbers on the links in
figure 4 are counts of the verified, paired and linked quotations). Further analysis of
all the paired codes displayed in figure 4 reveals answers to the study's research
questions and leads to recommendations for improving the effectiveness of the DBSC.
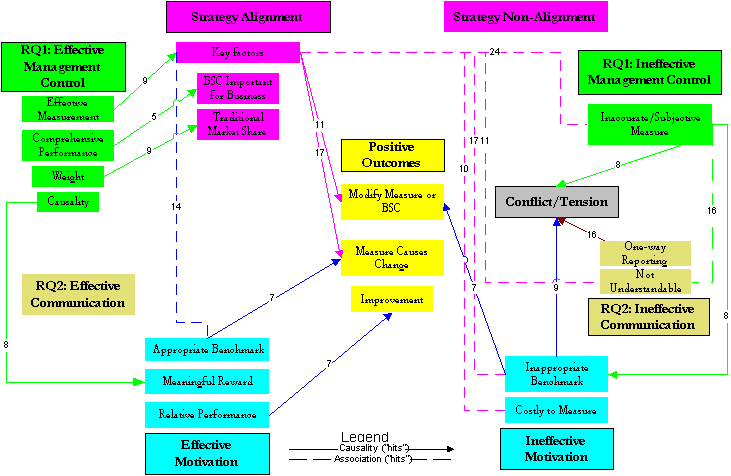
Figure 4 - Data-Supported Model
of Distributors' BSC Perceptions
It is interesting to note the
empirical trimming of the model in figure 3 and the possible implications for management
control and communication and the BSC. On the "effective" side of this model of
DBSC perceptions (figure 4), Effective management control causes Aligned with strategy and
Effective motivation, which in turn cause Positive outcomes (e.g., perception of
Improvement. These are consistent, strong associations between specific factors that tell
a coherent story, which we interpret as evidence of causality. There is, however, no
consistent evidence of a direct link between Effective management control and Positive
outcomes. In this model, Effective management control affects Positive outcomes through
Aligned with strategy and Effective motivation. These data provide support for the
"effective" form of research question 1.
![figure_3[1].gif (13413 bytes)](figure_3.gif)
Figure 3 - Expected Model of
Employees' DBSC Perceptions
Surprisingly, there are no
consistent links between perceptions of Effective communication and any other DBSC model
factor, which provides no support for the "effective" form of research question
2.
On the "ineffective"
side of the model, Ineffective management control, Ineffective communication, and
Ineffective motivation are associated or causally related. Furthermore, they cause
Conflict/Tension, which provides support for "ineffective" forms of research
questions 1 and 2. Ineffective motivation also is causally linked to Positive outcomes,
which was not expected but is explainable given the specific factors involved ...“
Inappropriate benchmarks cause recommendations to Modify measures or BSC. Perhaps
surprisingly, Aligned with strategy is associated with Ineffective management control,
Ineffective communication, and Ineffective motivation, but these, too, are explainable
given company circumstances. In this situation, aligning managers' goals with the
company's strategy using the DBSC causes Conflict/Tension when alignment is forced by
ineffective implementation. We now address each of the causal and associative links in the
context of the research questions, beginning at the upper-left corner of figure 4.
QUESTION 1:
DOES THE
EVIDENCE SUPPORT CAUSAL PATHS FROM (IN)EFFECTIVE BSC MANAGEMENT CONTROL TO STRATEGIC
(NON)ALIGNMENT, (IN)EFFECTIVE MOTIVATION, AND (POOR) GOOD PERFORMANCE?
Effective Management Control
> Strategy Alignment > Positive outcomes. As expected, BSC characteristics of
Effective management control (Effective measurement, Comprehensive performance, and
Weight) are causally linked with Strategy alignment (9 causal links with Key factors, 5
with BSC important for business, and 9 with Traditional market share, respectively).
Distributors perceive that availability of reliable data leads to the ability to take
strategically important actions (e.g., 17 causal links with Measure causes change), which
might not have been feasible before the DBSC. For example, as in the use of customer
satisfaction measures:
"We [now] give the work to
an outside service. They call a couple of customers every day. We get input on a list of
questions. If the customer ends up not having a good experience, (now) we can get that
info that day and call the customer ourselves" [8: 119-122].
Because the DBSC measures
Comprehensive performance, including the key financial and non-financial measures, it is a
reflection of overall success of managing critical factors (BSC important for business).
Thus, managers have a better feel for how they are managing the overall business for both
current and future results.
"The BSC is trying to give
us a broader business set of measures of success than the more traditional financial and
market share. It wraps a set of things together that make sense for managing the
business" [3: 5-7].
One of the company's key
strategic goals is to increase its traditional market share. The relatively heavy Weight
placed on this DBSC measure forces distributors (sometimes reluctantly) to align their
goals with improving the traditional market segment. They value their relationship with
the company, and the DBSC tells them what they must do to be a successful distributor,
though they interpret this to mean they should pursue improvements in traditional market
share to the exclusion of other growth opportunities.
"If they care only about
one-third of their business, then that's good. It's worth 28 points on the BSC. I'm red
and yellow there so there's no hope to be green from all the other measures... . They are
measuring only (traditional) market penetration... . Balanced scorecard is certainly a
misnomer" [2: 122-126].
By including Key factors, the
DBSC causes distributors to change their processes and actions (Measure causes change) in
significant ways and leads to numerous recommendations to Modify measures or BSC (11
causal links). Measuring the percentage of customers' problems diagnosed within one hour,
for example, caused most distributors to refocus their parts and service resources.
"This (measure)
differentiates our businesses from our competition. It requires a complete change of
'culture' within the shop. Now we have to manage the service event instead of just
scheduling work" [1:102-104].
In the past, distributors had
favored large, complex service jobs that were relatively easy to schedule and that could
be counted on to occupy technicians and service space for blocks of time. Customers who
had simple service requirements were placed in the service queue in order of arrival, with
no preferential treatment, with the result that many began to take their simple jobs
elsewhere and with the risk that they would be lost as permanent customers. Distributors
observed that:
"(One-hour diagnosis)
requires a change in measurement and is creating a new mindset within the service
organization... We can't schedule it; we have to provide the capacity and the process [1:
233-239]. [One-hour diagnosis] tends to make us triage like a hospital and do the quick
jobs first [2: 58-59]. I wasn't an advocate at the start, but now I am. It tells us how
quickly we figure out what's wrong so we can make an intelligent statement to the
customer, and so they can say 'go ahead' or not. We have been able to flow more jobs
through our shop by getting the quick, easy stuff through the shop. It lets us turn jobs
quicker and avoids embarrassing situations... It's helping us, though it's not easy to
change the mentality, but it's good" [6: 56-63].
Though there is no evidence of
a direct link from Effective management control to Positive outcomes, the data otherwise
provide extensive support for the "effective" form of research question 1.
Effective management control using the DBSC appears to cause Strategic alignment and
indirectly to cause Positive outcomes.
Effective Management Control
> Effective motivation > Positive outcomes. The DBSC's motivational impacts were
obvious overall and with respect to specific factors. Incentives included both improved
distributor business performance and successful contract renewals. The design of the DBSC
reflects the Causality of the business, which causes Meaningful rewards (8 causal links).
Distributors believe that improving non-financial DBSC measures will result in significant
financial rewards.
"(Service utilization is)
the most important number in the whole business [5: 102]. I gave the formula to our guys
that, if we bill our technicians out (on average) one more hour a day, we would put over
$X million to our (annual) bottom line. That's the kind of magnitude were talking
about" [4: 79-82].
The DBSC is successful as a
motivational tool when it reflects relations between Strategic alignment and distributor
performance. For example, setting Appropriate benchmark targets for motivation goes
hand-in-hand with management control of Key factors (14 association links). Distributors
do not object to tough, but attainable goals.
"Good measurement. Don't
have a problem with that hurdle. Huge issue and can't stress it enough. We have about
(xxx) hours. I can have one per year to be green. That's a tight hurdle. It's probably a
little tight right now" [4: 88-91].
Furthermore, setting attainable
but tough DBSC goals (Appropriate benchmarks) motivates distributors to change their
decisions and processes (Measure causes change).
"80% of work is in 4-hour
range in our service shop. Great number because the mentality in our shops had been that
we want that big overhaul, the long, lengthy jobs. But then, service efficiency suffers.
We didn't turn many jobs and lost a lot of hours because there is a good chance of losing
hours [on a large job]... Give the company credit for the four-hour target. They thought
about it; it's probably the industry norm. Focusing on this number has changed some of the
culture or at least the thought process in the shop. We changed to the little jobs and we
can get the big jobs later. So our management has awakened to the fact that they can
manage their shops better using the one-hour diagnostic time and four-hour jobs to make
their shops more efficient" [4:47-59].
Relative performance evaluation
allows each distributor to know his relative standing and what others are doing, and
thereby motivates distributors and gives them a tool for Improvement (7 causal links).
"(Gathering) the
information and sharing it back to us, saying other distributors are X. I can look at it
and see how I am doing. Why am I different? I can use it as a lever to try to
improve" [7: 123-125].
The data provide consistent
evidence of causation and support the contention that perceptions of this BSC's effective
management control characteristics lead to effective motivation, strategic alignment, and
positive outcomes, in support of the first research question.
Ineffective Management
Control > Ineffective motivation > Conflict/tension. Note that this study found
no consistent or frequent links between any of the elements of Strategy non-alignment and
other DBSC-model factors. However, Key factors that are poorly represented in the DBSC are
associated with numerous examples of other shortcomings. Notably, Inaccurate/subjective
measures of Key factors (24 associations) contribute to perceptions of Inappropriate
benchmarks (8 causal links), which cause widespread Conflict/tension (9 causal links).
This nexus of factors appears to be responsible for much of the Conflict/tension caused by
the use of the DBSC (17 out of 33 causal links). For example:
"(The measure is) a bunch
of 'hooey' as far as keeping score, but for us running our business it's an important
measure. What we do internally is what's important, not if we get a "star" on
our shoe. This is one area if the company wants to improve, we need to be a lot more
consistent and define that criterion much more closely. We routinely measured ourselves
before the company did this. We gauge ourselves monthly on this one. We ignore the BSC
measure for our purposes, and use our own." [1: 128-135]
"(Safety is a) hot button.
The BSC uses a totally ludicrous measure, but the concept is great. I have written four
memos on this subject. I ran two plants before this. I have 100 technicians, and if those
100 have more than one accident in a year, I'm in the red. Ridiculous." [6: 109-111]
The data provide consistent
evidence of causal paths connecting Ineffective management control, Ineffective
motivation, and Conflict/tension, which support the "ineffective" form of
research question 1.
QUESTION 2:
DOES THE EVIDENCE SUPPORT CAUSAL PATHS FROM
(IN)EFFECTIVE BSC COMMUNICATION CHARACTERISTICS TO STRATEGIC (NON)ALIGNMENT, (IN)EFFECTIVE
MOTIVATION, AND (POOR) GOOD PERFORMANCE?
Effective Communication >
Strategy alignment or Effective motivation > Positive Outcomes. Unexpectedly, the
study found no consistent evidence of specific relations between the attributes of
Effective communication and other DBSC-model factors. Perhaps perceptions of effective
communication are redundant to perceptions of effective management control, but
distributors' use of language related to effective communication could not be associated
with other DBSC factors. Occasionally, a distributor praised the design and availability
of the DBSC on the company's intranet, but the associations of these comments with
Strategic alignment, Effective motivation, or Positive outcomes were rare. Nonetheless,
nearly all distributors talked naturally about performance in terms of color ratings and
rankings. For example,
"I would be really
reluctant to post this on the bulletin board. I don't want customers or technicians to see
red" [1: 154-156]. "If you're red you're an idiot" [3: 172]. "By
seeing it all, you can just call someone up and say, -˜How did you get green in
service utilization?'" [4: 188]. "We were yellow, now we're bright red" [9:
59]. "We are competitive, so it matters what rank you are- I want to be number
one" [5: 18].
The study's data and method of
analysis do not obviously link Effective communication with other DBSC-model factors. It
nevertheless seems likely that making the numerical DBSC scores clear and understandable
to all via color ratings and rankings does greatly reinforce the DBSC message and does
contribute in a general way to changes and improvements. If nothing else, both color
ratings and rankings from this DBSC have changed the company's language and reinforce its
already competitive culture. Overall, however, this study does not find that Effective
communication is either associated with or causes Strategic alignment, Effective
motivation, or Positive outcomes. This does not support the "effective" form of
research question 2.
Ineffective Communication
> Strategy non-alignment or Ineffective motivation > Conflict/tension.
Ineffective communication appeared to be largely independent of other
"ineffective" DBSC factors. However, though the study found little evidence of
the impact of Effective communication, there was abundant evidence that the DBSC
administrators' frequent use of One-way reporting is a direct cause of Conflict/tension
(16 causal links).
Unfortunately, the
Conflict/tension appeared to be unproductive (i.e., no consistent links to Positive
outcomes). This may contribute to a climate of distrust and alienation that reduces the
company's and its distributors' effectiveness. When the company imposes DBSC measures and
benchmarks without seeking input and then uses the DBSC as an evaluation tool,
distributors feel ignored and trivialized, but they have little recourse because of the
frequency of One-way reporting, which was a common complaint.
"No response (to my
complaints), so we stand by our measure. I've gotten no response to my concerns, and I'm
-˜PO'd' at them on this subject. Any distributor who is green is a liar. No realistic
way in hell that that can happen. The nature of the work we do, we just can't do this-. Do
they have any idea what the distributor environment is? They don't care enough to
reconcile issues, but the factor itself is important" [6: 116-123].
Partly as anticipated, the data
provide support for the "ineffective" form of research question 2: Ineffective
communication, specifically One-way reporting, has largely negative consequences for
perceptions and reported uses of the DBSC.
ADDITIONAL PATHS
Strategy Alignment -“
Ineffective management control or Ineffective communication or Ineffective motivation
-“ Positive outcomes. The study found numerous associations that at first glance
appear to be anomalous. Upon reflection, however, it is not surprising that complaints
about Inappropriate benchmarks are causes of recommendations to Modify measures or BSC.
Clearly, distributors want goals for DBSC Key factors that will lead to business success.
For example,
"Is the x% (benchmark
percentage of technician hours used for training) appropriate? Hard to say. Probably now,
that would be a low number given (that)-the company will completely obsolete its own
product line soon. The need for training is much greater today than it has been in the
past. Some companies will use training dollars (rather than percentage of training hours).
They are at like 5% (of revenues), which is much higher than us. This raises a question in
our minds. Do we do enough? We are concerned if we are reinvesting enough in our
employees." [1: 183-190]
Additionally, the most
numerous, consistent evidence (62 associations shown in dotted lines on the right side of
figure 4) shows that Key factors are associated with Inaccurate/subjective measures, Not
understandable messages, Inappropriate benchmarks, and Costly to measure. Distributors are
frustrated when they perceive ineffective implementation of DBSC factors that they believe
are key to their business success and contract renewal. Typical comments, for example
involving the DBSC measure of training for salaried employees, include:
"(Training of salaried
employees is) as critical (as for technicians) but harder to measure. We have to use some
guessing, because they are not paid hourly. Also, what's training? Clearly going to a
class during the workday, but what about going after work? What percent of the total
salaried hours is that?" [5: 155-160]
"For salaried people, it's
harder. We have to look at expense reports, and it's a horrendous process. When you bring
this data collection problem to the company, they say we can't do that either. They don't
even do it, and they aren't sure of the credibility of their number. From feedback from
other distributors, they are just taking a stab at it. We actually compile the numbers,
but others are getting green scores for just a guess. We're yellow or red, and it's a real
number. The cost of the time isn't worth it. But, it's the right idea and the right thing
to do." [1: 175-183]
Distributors' frustrations were
obvious when they realized that the DBSC was attempting to measure and communicate
important success factors, but that it was doing so ineffectively.
"We don't grow much, so we
need to find ways to expand. That's all they pushed here (in contract renewal). At another
distributor, all they pushed on was customer satisfaction. Some areas if know we're doing
a bad job and were red, they don't seem to care-. Great tool but I'm not sure we are using
it the way it should be used" [8: 175-181]. "This is something we all should pay
more attention to. We haven't done as well as we should have, but the goal means nothing
to me because I'm so far away from it" [5: 122-125].
While the study did not
anticipate these (and other similar) associations, their discovery provides ample
additional evidence of opportunities to improve the control and communication of strategy
with the DBSC.
SUMMARY OF RESULTS
The BSC is an innovative strategy communication and management control development.
However, as with all innovations, establishing its validity takes time, objective
evidence, and careful analysis. There is always the danger that promotional
"hype" will promise more than a technique can deliver, which could lead to
disappointment, skepticism, and failure to recognize significant benefits, even if they
are not as grand as advertised. Kaplan and Norton [1996] bill the BSC as a complete,
reliable strategic guide. It perhaps may prove to be just that. However, there has been
almost no objective evidence presented in support of this proposition. Most of the BSC
literature is either normative prescription or uncritical reports of BSC
"successes." To our knowledge, this paper reports the first objective evidence
about the BSC "in the real world." We believe this study provides a significant
contribution to the literature, of interest to academics and managers alike.
Our findings are that, in at
least one corporate setting, the BSC does present significant opportunities to develop,
communicate, and implement strategy -“ just as Kaplan and Norton aver. We find
evidence that managers respond positively to BSC measures by reorganizing their resources
and activities, in some cases dramatically, to improve their performance on those
measures. More significantly, they believe that improving their BSC performance is
improving their business efficiency and profitability. Managers react favorably to the BSC
and heed its messages when:
BSC elements are measured
effectively, aligned with strategy, and reliable guides for changes, modifications, and
improvements
The BSC is a comprehensive
measure of performance that reflects the needs of effective management
The BSC factors are seen to
be causally linked to each other and tied to meaningful rewards
BSC benchmarks are
appropriate for evaluation and useful for guiding changes
Relative BSC performance is a
guide for improvement
However, problems of designing
and implementing the BSC may be no different from those associated with any major change
in performance-measurement systems. The following factors were found to negatively affect
perceptions of the BSC and cause significant conflict and tension between the company and
its distributors.
Measures are inaccurate or
subjective
Communication about the BSC
is one-way (i.e., top-down)
Benchmarks are inappropriate
but used for evaluation
Though some of these adverse
findings are associated with recommendations for improvement, most are found to be causes
of unproductive conflict and tension or a general atmosphere of ineffectiveness. For
example, the study found many perceptions of key factors that were ineffectively
implemented in the company's BSC. Left uncorrected, these negatives could result in
deteriorated relations and failure to realize the potential benefits of the BSC. On the
brighter side, these lists represent value-added and non-value-added BSC activities. To
successfully design, implement and use the BSC, organizations should enhance the former,
positive factors and eliminate or correct the latter, negative factors. It may be worth
noting that the total number of consistent linkages on the "ineffective" side of
the model in figure 4 far outweighs those on the "effective" side (154 to 59).
Thus, the predominance of negative perceptions reflects many opportunities to improve both
communication and control of strategy. It seems likely that this ineffectiveness could be
resolved and the negative outcomes of unnecessary conflict and tension could be avoided at
relatively low cost (though it may require significant changes in attitudes). Possible
solutions could be as simple as improved dialogue between the company and its distributors
regarding important but ineffectively measured or poorly understood DBSC factors [e.g.,
Lindquist, 1995].
LIMITATIONS AND FUTURE
RESEARCH
Even though many of this company's administrators and distributors apparently use the DBSC
as a valid representation of their business, we recognize that their reported perceptions
may not be valid representations of their actions. To our knowledge, however, there has
been no rigorous, statistical test of the claim that the BSC is, in fact, a causal model,
which should be the focus of future research.
We can say very little about
the statistical properties of the host company's DBSC at this time, particularly since
time lags between changes in investments in people, marketing, and internal processes may
not result in tangible financial improvements for six months or several years.
"You will see very little
change from quarter to quarter. Last quarter only one measure changed" [9: 121-124].
"I expect a three to five-year lag to see a significant impact of market penetration
investments. I'm spending a gazillion dollars on it, but returns will be in about five
years. We'll see some short-term returns soon, but the big returns are five years down the
road" [2: 148-151]. "My gut feeling is that it took two to three years to
reorganize and retrain, and four or five years later it started to pay off. I expect a
quicker response now from improving the fill rate and one-hour diagnosis" [6:
205-207]. . I would think about half a year to a year for the parts fill rate. Do well,
and your reputation becomes known and you'll see some effect in the financials. It's a
matter of customer awareness that we're doing something different here that will bring
repeat business" [3:130-133].
"People are very
sensitive. They let us know if we are not living up to expectations. Some of our customers
are looking elsewhere to get parts because of stocking problems. Customers will react in a
six-month window" [1: 217-223]
Practical difficulties that
will be encountered in any statistical test of a BSC include:
Changes in BSC measures and
linkages as systems evolve to meet changing conditions
Changes in organizations,
markets, and personnel that may affect BSC structure and linkages
Long lead times before
effects are seen in lagging measures of performance
No effects or negative
results that may be attributed to "bad design" or "bad implementation"
rather than to the concept of the BSC as a causal model
Desirable effects or positive
results that may be caused by other, related (but omitted) factors, but are attributed to
the BSC
Making progress on controlling
these factors offers opportunities for significant contributions to our understanding of
complex performance measurement systems such as the BSC.
REFERENCES
Abernethy, M. and P. Brownell. 1997. Management control
systems in research and development organizations: The role of accounting, behavior and
personnel controls. Accounting, Organizations and Society 22: 233-48.
Ahrens, T. and J.F. Dent. 1998.
Accounting and organizations: Realizing the richness of field research. Journal of
Management Accounting Research 10: 1 - 39.
Amir, Eli and Baruch Lev. 1996.
Value-relevance of non-financial information: The wireless communications industry. Journal
of Accounting and Economics. 22(1-3): 3-30.
Amit, R. and P. Shoemaker.
1990. Strategic assets and organizational rent. Strategic Management Journal 14:
33-46.
Antle, R. and J. S. Demski.
1988 The controllability principle in responsibility accounting. The Accounting Review
63(4): 700-18.
Atkinson, A.A., R.
Balakrishnan, P. Booth, J.M. Cote, T. Groot, T. Malmi, H. Roberts, E. Uliana, and A. Wu.
1997. New directions in management accounting research. Journal of Management
Accounting Research 9: 70-108.
Atkinson A.A. and W. Shaffir.
1998. Standards for field research in management accounting. Journal of Management
Accounting Research 10: 41 - 68.
Banker, R.D. and S. Datar.
1989. Sensitivity, precision and linear aggregation of signals for performance evaluation.
Journal of Accounting Research 27: 21-39.
Banker, R.D., H. Chang and S.
K. Majumdar. 1993. Analyzing the underlying dimensions of firm profitability. Managerial
and Decision Economics 14(1): 25-36.
Banker, R.D., G. Potter and
R.G. Schroeder. 1995 An empirical analysis of manufacturing overhead cost drivers," Journal
of Accounting and Economics 19(1): 115-37.
Banker, R.D., S. Lee and G.
Potter. 1996. A field study of the impact of a performance-based incentive plan," Journal
of Accounting and Economics 21(2): 195-226.
Banker, R.D., G. Potter, D.
Srinivasan. 2000. An empirical investigation of an incentive plan that includes
non-financial performance measures. The Accounting Review 75: 65-92.
Barker, R.T. and M.R. Camarata.
1998. The role of communication in creating and maintaining a learning organization:
Preconditions, indicators and disciplines. Journal of Business Communication 35(4):
443-467.
Barth, M. E. and M.F.
McNichols. 1994. Estimation and market valuation of environmental liabilities relating to
superfund sites," Journal of Accounting Research 32(Supplement): 177-219.
Barth, M.E., M.F. McNichols and
G.P.Wilson. 1997 Factors influencing firms’ disclosures about environmental
liabilities," Review of Accounting Studies 2(1): 35-64.
Baxter, J.A. and W.F. Chua.
1998. Doing field research: Practice and meta-theory in counterpoint. Journal of
Management Accounting Research 10: 69 - 87.
Behn, B. K. and R. A. Riley.
1999. Using non-financial information to predict financial performance: The case of the US
airline industry. Journal of Accounting, Auditing & Finance 14(1): 29-56.
Brewer, P.C. 1998. National
culture and activity-based costing systems: A note. Management Accounting Research
9(2): 241-260.
Daft, R.L. and A.Y. Lewin.
1993. Where are the theories for the "new" organizational forms? An editorial
essay. Organization Science 4: i-vi.
Dearden, J. 1969. The case
against ROI control. Harvard Business Review. May-June: 124-35.
De Hass, M. and A. Kleingeld.
1999. Multilevel design of performance measurement systems: Enhancing strategic dialogue
throughout the organization. Management Accounting Research 10: 233-61.
Dillman, D. 1978. Mail and
telephone surveys: The total design method. New York: John Wiley & Sons.
Dixon, J.R., A.J. Nanni, and
T.E. Vollman. 1990. The New Performance Challenge: Measuring Manufacturing for World
Class Competition. Homewood, IL: Dow Jones-Irwin.
Epstein, M.J. and J. Manzoni.
1997. The balanced scorecard and tableau de bord: Translating strategy into action," Management
Accounting 79: 28-36.
Feltham, G. and J. Xie. 1994.
Performance measure congruity and diversity in multi-task principal/agent relations. The
Accounting Review 69: 429-53.
Foster, G. and M. Gupta. 1990.
Manufacturing overhead cost driver analysis. Journal of Accounting and Economics
12(1-3): 309-37.
Foster, G. and M. Gupta. 1999?
Customer profitability working paper.
Ghosh, D. and R.F. Lusch. 2000.
Outcome effect, controllability and performance evaluation of managers: Some field
evidence from multi-outlet businesses. Accounting, Organizations and Society 25:
411-25.
Goodman, M.B. 1998. Corporate
Communications for Executives. Albany, NY: SUNY Press.
Gordon, L. and V. Naranyan.
1984. Management accounting systems, perceived environmental uncertainty and organization
structure: An empirical investigation. Accounting, Organizations and Society :
33-47.
Govindarajan, V. 1984.
Appropriateness of accounting data in performance evaluation: An empirical examination of
environmental uncertainty as an intervening variable. Accounting, Organizations and
Society : 125-135.
Govindarajan, V., and A. Gupta.
1985. Linking control systems to business unit strategy: Impact on performance. Accounting,
Organizations and Society 10: 51-66.
Grant, R. 1991. The
resource-based theory of competitive advantage. California Management Review 33:
114-135.
Holmstrom, B. 1979. Moral
hazard and observability. Bell Journal of Economics 10: 74-91.
Hughes, K.E. 2000. The value
relevance of non-financial measures of air pollution in the electric utility industry. The
Accounting Review 75(2): 209-28.
Ittner, C.D. and D.F. Larcker.
1997a. Quality strategy, strategic control systems, and organizational performance. Accounting
Organizations and Society 22(3/4): 293-314.
Ittner, C.D. and D.F. Larcker,
1998b. Are non-financial measures leading indicators of financial performance? An analysis
of customer satisfaction. Journal of Accounting Research 26(supplement): 1-34.
Ittner, C.D. and D.F. Larcker.
1998c. Innovations in performance measurement: Trends and research implications. Journal
of Management Accounting Research 10: 205-38.
Johnson, H.T. 1992. Relevance
Regained: From Top-Down Control to Bottom-Up Empowerment. New York, NY: The Free
Press.
Johnson, H.T. and R.S. Kaplan.
1987. Relevance Lost: The Rise and Fall of Management Accounting. Boston, MA:
Harvard Business School Press.
Kaplan, R.S. and D.P. Norton.
1992. The balanced scorecard - Measures that drive performance. Harvard Business Review
January - February: 71-79.
Kaplan, R.S. and D.P. Norton.
1993. Putting the balanced scorecard to work. Harvard Business Review September -
October: 143-142.
Kaplan, R.S. and D.P. Norton.
1996a. Using the balanced scorecard as a strategic management system. Harvard Business
Review January - February: 75-85.
Kaplan, R.S. and D.P. Norton.
1996b. The Balanced Scorecard. Boston, MA: Harvard Business School Press.
Kaplan, R.S. and D.P. Norton.
1996c. Linking the balanced scorecard to strategy. California Management Review,
Fall: 53-79.
Keegan, D.P., R.G. Eiler, and
C.R. Jones. 1989. Are your performance measures obsolete? Management Accounting
:45-50.
Lindquist, T. 1995. Fairness as
an Antecedent to Participative Budgeting: Examining the Effects of Distributive Justice,
Procedural Justice and Referent Cognitions on Satisfaction and Performance. Management
Accounting Research, 7: 122-147.
Lipe, M.G. and S. Salterio.
1999. The balanced scorecard: Judgmental effects of information organization and
diversity. Working paper, University of Oklahoma.
Locke, E.A. and G.P. Latham.
1978. A Theory of Goal Setting and Task Performance. Englewood Cliffs, NJ: Prentice
Hall.
Luft, J. and M.D. Shields.
1999. Accounting classification of expenditures on intangibles: Cognitive causes of
managerial myopia. Working paper, Michigan State University.
Lynch, R.L. and K.F. Cross.
1995. Measure Up! Yardsticks for Continuous Improvement. Cambridge, MA: Blackwell
Business.
McKenzie, F.C. and M.D.
Schilling. 1998. Avoiding performance measurement traps: Ensuring effective incentive
designs and implementation. Compensation and Benefits Review 30(4): 57-65.
Merchant, K.A. 1989. Rewarding
Results: Motivating Profit Center Managers. Boston, MA: Harvard Business School Press.
Miles, M.B. and A. M. Huberman.
1994. Qualitative Data Analysis. Thousand Oaks, CA: SAGE Publications.
Norreklit, H. 2000. The balance
on the balanced scorecard - A critical analysis of some of its assumptions. Management
Accounting Research 11: 65-88.
Perera, S., G. Harrison and M.
Poole. 1997. Customer-focused manufacturing strategy and the use of operations-based
non-financial performance measures: A research note, Accounting Organizations and
Society 22(6): 557-572.
Rappaport, A. 1999. New
thinking on how to link executive pay to performance. Harvard Business Review.
Mar-Apr: 91-101.
Schulze, W. 1992. The two
schools of thought in resource-based theory: Definitions and implications for research.
Paper presented at the annual meeting of the Academy of Management, Las Vegas, Nevada.
Silk, S. 1998. Automating the
balanced scorecard. Management Accounting 79(11): 38-42.
Simons, R. 2000. Performance
Measurement & Control Systems for Implementing Strategy. Upper Saddle River, NJ:
Prentice Hall.
Tucker, M.L., D. Meyer, and
J.W. Westerman. 1996. Organizational communication: Development of internal strategic
competitive advantage. Journal of Business Communication 33(1): 51-69.
Ulrich, D. and D. Lake. 1990. Organizational
Capability: Competing from the Inside Out. New York, NY: Wiley.
Watson, D.J. and J.V. Baumler.
1975. Transfer pricing: A behavioral context. The Accounting Review 50: 466-74.
West and D. Meyer. 1997.
This ends Part 4 of 4