Internet Service Provider
(ISP) Business Plan
Web Solutions, Inc. (Web Solutions) is an Internet Service
Provider (ISP) based in Phoenix, Arizona. The company offers the following
services to its customers:
- Dialup and dedicated Internet access (up to 64 Kbps).
- High bandwidth Internet access (128 Kbps).
- Integrated Services Digital Network (ISDN).
- Digital Subscriber Line (DSL).
- Wireless.
- Website and virtual domain hosting.
- Server colocation.
- Network design, installation, and administration services.
- Web design (currently outsourced).
Web Solutions is a company driven to provide customers with a
complete solution to their entire current and future Internet and private
network needs. The company's customer base includes all consumers and all small-
to medium-sized businesses, including start-ups.
Web Solutions benefits from several strategic alliances by
receiving very competitive pricing on most services, allowing the company to
offer competitive pricing on its services to customers.
ISPs offer a way for people to enter the Internet. According
to International Data Corporation (IDC), an information technology research and
consulting firm located in Framingham, Massachusetts, the consumer ISP market
will expand from $10.7 billion in 1998 to $37 billion in 2003.
Competitive threats come from other ISPs located in or around
Phoenix, including the following companies: Jump.Net, Arizona.Net, EarthLink,
and Mindspring. Most competitors offer solutions for Windows, and perhaps
Macintosh, but ignore all other operating systems. With the rise of Linux and
other alternative operating systems, there is potential for Web Solutions to
surpass its competitors.
Web Solutions has a world-class management team with direct
knowledge of the industry, extensive research experience, and unique
administration skills. Its team includes Mr. Jason Williams, Mrs. Amy Williams,
and Ms. Geena James.
Projected revenues for 2000 through 2002 are $1.5 million,
$4.5 million, and $7.5 million, respectively. The company is seeking an
investment of $1.5 million. The company primarily needs capital to fund four
areas of growth in the company:
- Increase personnel to handle sales, service, and
development efforts.
- Increase marketing to assure future customers are aware of
our offerings and aggressive pricing.
- Expand our base of operations (using wholesale providers,
partnerships, and other mechanisms) to include at least the top 100 U.S.
markets for dialup and dedicated Internet access.
- Perform research and development to bring new products to
market.
The mission of Web Solutions is to provide customers with a
complete solution to all their current and future Internet and private network
needs.
Web Solutions has established a reputation for quality work
and plans to continue to enhance its image in the industry. The company seeks to
become a well-known and respected provider of advanced network solutions by:
- Increasing service offerings.
- Increasing availability and accessibility to current and
future customers.
- Creating innovative, unique, and cost-effective solutions
to problems currently faced by customers.
|
Web Solutions, Inc. is a C-class corporation,
incorporated in the State of Arizona in July, 1997. The company's
principal offices are currently located in Phoenix, AZ. All operations,
from administration to product development, take place at this leased
office location. The company plans to move to a bigger facility as it
expands and its staff grows beyond its current four full-time employees.
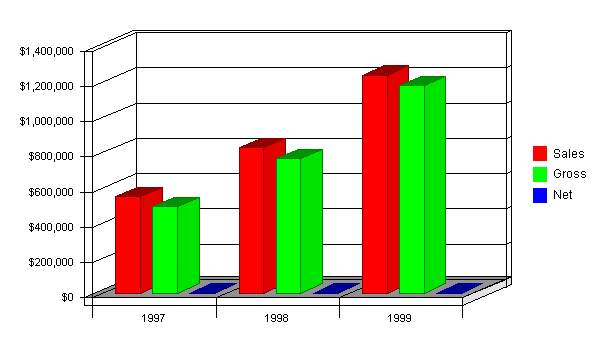
Past
Performance
Click to Enlarge
| Past
Performance |
| |
1997 |
1998 |
1999 |
| Sales |
$550,000 |
$825,000 |
$1,237,500 |
| Gross
Margin |
$490,000 |
$765,000 |
$1,177,500 |
| Gross
Margin % |
89.09% |
92.73% |
95.15% |
| Operating
Expenses |
$160,100 |
$180,100 |
$200,100 |
| Collection
Period (days) |
0 |
0 |
0 |
| Inventory
Turnover |
0.00 |
0.00 |
0.00 |
| |
|
|
|
| Balance
Sheet |
|
|
|
| Current
Assets |
1997 |
1998 |
1999 |
| Cash |
$50,050 |
$75,075 |
$112,613 |
| Accounts
Receivable |
$10,875 |
$15,400 |
$23,500 |
| Inventory |
$284,900 |
$427,350 |
$641,025 |
| Other
Current Assets |
$15,400 |
$23,100 |
$34,650 |
| Total
Current Assets |
$361,225 |
$540,925 |
$811,788 |
| Long-term
Assets |
|
|
|
| Capital
Assets |
$147,400 |
$221,100 |
$331,650 |
| Accumulated
Depreciation |
$0 |
$0 |
$0 |
| Total
Long-term Assets |
$147,400 |
$221,100 |
$331,650 |
| Total
Assets |
$508,625 |
$762,025 |
$1,143,438 |
| |
|
|
|
| Capital
and Liabilities |
|
|
|
| |
1997 |
1998 |
1999 |
| Accounts
Payable |
$50,750 |
$65,125 |
$70,688 |
| Current
Borrowing |
$40,150 |
$60,225 |
$90,338 |
| Other
Current Liabilities |
$40,150 |
$60,225 |
$90,338 |
| Subtotal
Current Liabilities |
$131,050 |
$185,575 |
$251,363 |
| |
|
|
|
| Long-term
Liabilities |
$287,100 |
$430,650 |
$645,975 |
| Total
Liabilities |
$418,150 |
$616,225 |
$897,338 |
| Paid-in
Capital |
$0 |
$0 |
$0 |
| Retained
Earnings |
$90,475 |
$145,800 |
$246,100 |
| Earnings |
$0 |
$0 |
$0 |
| Total
Capital |
$90,475 |
$145,800 |
$246,100 |
| Total
Capital and Liabilities |
$508,625 |
$762,025 |
$1,143,438 |
| |
|
|
|
| Other
Inputs |
1997 |
1998 |
1999 |
| Payment
Days |
0 |
0 |
0 |
| Sales
on Credit |
$0 |
$0 |
$0 |
| Receivables
Turnover |
0.00 |
0.00 |
0.00 |
|
Web Solutions currently delivers Internet service to dialup
and ISDN customers, and will commence to sell DSL services by February of this
year. The company currently hosts approximately 30 websites and has five
colocated servers. Additionally, the company is evaluating e-commerce software,
looking for the solution which provides the greatest flexibility while allowing
operations to remain simple for its customers.
All services are competitively price and targeted to small
"Mom-and-Pop" businesses and small office/home office (SOHO)
customers. Web Solutions feels that this market segment has largely been
neglected because of the amount of "hand-holding" required by this
segment, and the inability to pay the astronomical fees charged by many
ISPs for typically poor service and user support.
By working to simplify the creation, management, and support
of our services, the company will enable customers to perform many tasks
themselves, or automating these tasks based on the customer's stated needs. This
will make our pricing more competitive, the customers perception of service
high, and the operation as a whole more reliable and profitable.
With current hardware and facilities, the company can do the
following:
- Handle an unlimited number of dialup users.
- Handle up to 46 dedicated channels.
- Handle up to 1,000 email users.
Web Solutions is a traditional, full-service ISP, offering
dialup and dedicated Internet access, Web and virtual domain hosting, server
colocation, and network-related professional solutions (design, installation,
management, etc.). The company allows people and companies to access and publish
documents on the World Wide Web without the need to hire full-time system
administrators, costly high-speed network connections, dedicated servers, and
other similar expenses or expertise.
The company provides many of the services that customers need
to get online. The company provides both connectivity and consulting on topics
ranging from office automation to Web server planning. The company has ongoing
research and development to provide solutions to current customer issues
(e-commerce, ease-of-use features, etc.) and to develop new products and
services which enable the company to enter and compete in new markets and
attract new customers.
Web Solutions selects products which meet the following
criterion:
- Benefit to customers/company: the product must
materially benefit the customer or the company in some way. This may
manifest itself as a side benefit, an improvement on current services, or
additional revenue stream to the company.
- Cost/benefit ratio: the benefits realized must be at
least as great as the cost of implementation, production, and maintenance of
the product.
- Maintainability: the product must be maintainable by
PhoenixARIZONA.COM personnel. The company has had some experience with
products where source code and other maintenance resources are unavailable
and has had major difficulties with these restrictions. The company has a
strong preference for Open Source and similar distribution methods where
source code is available to personnel to correct problems which vendors
consider too unimportant to warrant effort on.
Web Solutions makes a concerted effort to keep customers
informed and to remedy problems in the shortest possible times. The company has
lost very few customers to technical support issues, and will continue to make
high quality support one of its primary goals.
Web Solutions offers telephone support during extended
business hours (8 a.m. to 8 p.m.) and has an on-call pager for emergencies
(network-down and server-down situations). In the future, the company plans to
implement a 24/7 network operations center (NOC) and a toll-free technical
support phone number.
When the voice/video/data (VVD) product goes into production,
the company plans to have constant monitoring of network connectivity and take
preemptive measures to solve developing problems before the customer even
notices them. For instance, if it is determined that there is a failing
component on the customer's premise equipment, it would trigger a call to the
customer and the scheduling of a replacement part before the customer even
realizes that the problem exists.
Currently, all products are implementations of Open Source
products. The groupware product will be based upon OpenDesk.com's software,
which is available under an Open Source license. Web Solutions will be extending
the functionality of this product, and release those changes back to the
development community.
With the VVD product, the company will have to design and
manufacture custom equipment for customers to receive the data and convert it to
video or voice.
Currently, the company has no products to return. The
company's usage policy states that it will refund a portion of the customers'
monthly access fee if there are extended network outages due to events within
our control.
The company gives technical advice to pre-sales customers and
technical support is offered for all purchases by the customer. These
services are offered by Web Solutions at no cost to our clientele.
Free (advertiser supported) back-office service with email,
file sharing, calendaring/scheduling, and other applications are options for
future services from Web Solutions. This would allow groups (both for-profit and
nonprofit) to have the collaboration enjoyed by major corporations with
multimillion-dollar management information systems (MIS) budgets for little or
no cost. It also would produce an avenue through which to offer future free and
pay services.
Web Solutions plans to have the initial launch of the
back-office product by March 31st. The company currently has a potential
customer (a local radio station) who wishes to privately brand this product and
offer it to their customers.
Web Solutions is in the process of researching a future
service of integrated voice, video, and data over high speed TCP/IP network
connections (DSL, etc.) so as to merge the traditional telephone, cable, and ISP
functionalilities, extend them, and affordably offer them to consumers. This
product would compete directly with traditional cable and telephone companies,
and provide new and innovative revenue streams. Current plans for this product
are to price the consumer product very aggressively and take the profit from
secondary services such as advertising. Web Solutions plans to have a working
prototype of the server and clients needed for the VVD product by October 1,
2000, and a limited launch by March 1, 2001.
The topics which follow discuss our customers, our
competitors, and conditions within our industry. The Market Analysis data found
in the following table and chart is taken from the 1997 U.S. Census.
Market
Analysis (Pie)

Click to Enlarge
| Market
Analysis |
| Potential
Customers |
Growth |
2000 |
2001 |
2002 |
2003 |
2004 |
CAGR |
| Household
Consumers |
10% |
101,041,000 |
111,044,059 |
122,037,421 |
134,119,126 |
147,396,919 |
9.90% |
| Small
Office/Home Office |
3% |
16,963,070 |
17,404,110 |
17,856,617 |
18,320,889 |
18,797,232 |
2.60% |
| Total |
8.94% |
118,004,070 |
128,448,169 |
139,894,038 |
152,440,015 |
166,194,151 |
8.94% |
The company's customer base includes all consumers and all
small- to medium-sized businesses, including start-ups. The company plans to
concentrate on SOHO clients, as these are perfect targets for our new high-speed
offerings, and hold the greatest growth potential for the company. Web Solutions
feels that these market segments have special pricing and service needs, and
make more dedicated, reliable customers.
The following sub-topics look at the size and concentration of
businesses in this group, the way services are bought and sold, and specific
competitors.
The company is competing in the low-cost Internet access and
website hosting niche of the industry. The industry is moving in the direction
of a fusion of VVD services over a single common media (ref. The AOL-Time/Warner
merger). This is where all media players must move in order to compete in the
coming decade.
The alternative is to be a content provider. This is a less
desirable position as it leaves the company too much at the whim of the public
and forces the company to renew its efforts continuously to provide usable
content.
The ISP industry has begun the process of specialization. Many
companies who began by filling all needs (as we do today) have moved into areas
which utilize their strengths. These specializations include:
- Colocation ("Server Hotel") facilities.
- Web hosting.
- Dialup access.
- Content provision.
Additionally, there are a few new markets emerging, such as
Applications Service Providers.
- Access services
ISPs offer a way for people to enter the Internet.
According to IDC, America Online (including subscribers to CompuServe, which
AOL acquired in September, 1997), has approximately a 43% share of the total
subscribers in the ISP segment, followed by Microsoft's MSN, and AT&T
Corporation's WorldNet. After these major players, roughly 5,000 ISPs fight
over the remainder of the market. IDC estimates that the consumer ISP market
will expand from $10.7 billion in 1998 to $37 billion in 2003.
When users access the Internet, they dial into the local
point of presence (POP) of an ISP or online service provider (OSP). ISPs
offer basic, flat-rate Internet access to customers, either through their
own networks, or through networks leased from other ISPs. Users dial into an
ISP's network through ordinary phone lines and, using a browser, access the
Web. OSPs, such as America Online, provide original content in areas such as
shopping, news groups, gaming groups, investor information, and magazines.
Access fees for both ISPs and OSPs typically range from
$19.95 to $21.95 per month for unlimited Internet use. The flat rate system
was pioneered by America Online in 1996 and has led to an explosion of
subscribers. Flat rates have also served to increase the amount of time that
users spend online, which has forced many local telephone service companies
to upgrade capacity in order to accommodate the heavy usage.
- A taxing issue
One nettlesome issue that could potentially slow the
growth of e-commerce is the taxation of goods and services. Currently, fees
paid to ISPs and OSPs are tax-free, except in a few states. Purchases,
however, are subject to the same taxes that apply to goods sold in a store
or catalog. When online purchases are made, purchasers are technically
responsible for remitting state and local taxes. The only exception occurs
when a consumer buys from a corporation with a physical presence in that
consumer's home state. In actuality, however, online shoppers rarely pay
this cyber-taxation.
While state and local governments are disturbed at this
loss of revenue--and the potential loss of immense future revenue--federal
governmental officials have adopted a hands-off policy with regard to
Internet taxation. In October, 1998, the Internet Tax Freedom Act was
passed, placing a three-year ban on any new Internet sales taxes or taxes on
ISPs. During this three-year time frame, a committee of government and
business representatives known as The Advisory Commission on Electronic
Commerce will meet to discuss a more permanent tax policy. The 19 members of
the commission include three federal officials, eight business and consumer
leaders, and eight representatives of state and local governments.
- ISPs face challenges
The rise in Internet users has proven to be a boon for
Internet service providers, which charge monthly subscription fees in return
for providing access. While business has been good for many of these ISPs, a
number of challenges threaten the long-term growth and profitability of
these companies.
- Broad access becomes more prevalent
Today, most residential Internet users gain access to the
Web via commonplace copper telephone wires. Download speeds are limited to a
maximum 56 Kbps and are often significantly slower than that, resulting in
frustration among impatient Web surfers. The lack of speed has provided an
opportunity for broadband service providers to gain market share. LLC's
RoadRunner, which provides high-speed online access, has begun to attract
users who desire more speed and are willing to pay a higher price. As of the
second quarter of 1999, cable modem users numbered over 1 million, still a
small percentage of total Internet users, but growing very rapidly.
- "Free" Internet access proves viable
While most headlines or advertisements proclaiming free
Internet service are actually a bit misleading, the impact of this business
model is starting to be felt. The most prominent and successful example of a
free ISP is in the United Kingdom, where Freeserve plc does not charge its
customers access fees. Unlike the United States, however, local calls in the
United Kingdom are billed on a per-minute basis, so heavy Internet users may
actually pay more than in the United States.
In the United States, different types of "free"
plans are being marketed. One strategy gives a subscriber free service in
exchange for having advertisements scroll constantly across his or her PC
screen. A different slant to this marketing scheme allows a consumer to earn
a free personal computer, provided that he or she signs up for a few years
of Internet service in advance.
The following is a list of services which various websites
provide:
- Destinations. Destinations are places, or websites,
located on the Internet where people can go for information, entertainment,
or commerce.
- Content providers. This type of website offers
mostly original content (like news articles) to subscribers. Some of the
major content providers include ESPN Sports Zone (a joint venture between
Infoseek Corp. and Walt Disney Co.), SportsLine USA Inc., privately held The
Motley Fool Inc., and MSNBC (a joint venture between Microsoft and NBC).
With new websites being established every day, it's difficult to come up
with a reasonable estimate for the size of this market.
- Portals. These websites tend to gather content into
one place rather than creating it themselves. Some of the major portals
include Yahoo! Inc. (1998 sales of $206 million), Infoseek Corporation ($63
million in fiscal year 1998), and Lycos Inc. ($56 million in fiscal year
1998). Although e-commerce has started to become a larger promotion of these
companies' business, portals typically rely on the sale of advertising space
to generate revenue.
According to Jupiter Communications, a market research
firm based in New York City, advertisers spent approximately $2 billion for
online ads in 1998. Jupiter believes that this number will hit $9 billion in
2002.
- Communities. Communities are similar to portals, in
that their primary revenue streams come from advertisers. Some of the major
community sites include Geocities (1998 sales of $18.4 million), now a part
of Yahoo! Xoom.com Inc. ($8.3 million), and theglobe.com Inc. ($5.5
million).
- Business-to-consumer e-commerce. Estimates for the
amount of online spending by consumers in 1998 range from $7 billion to $13
billion, with at least 25% occurring during the Christmas shopping season.
Forrester Research, an information technology research firm in Cambridge,
Massachusetts, believes that online retail spending will hit $108 billion in
2003.
Some of the major publicly traded online retailers
included Amazon.com Inc. (1998 sales of $610 million), CDnow Inc. ($98
million), barnesandnoble. com Inc. ($62 million), and Beyond.com corp. ($37
million). A variety of "real-world" companies including Gap Inc.,
Lands' End Inc., and Macy's have established retail operations on the
Internet.
- Business-to-business e-commerce. Although there are
very few pure business-to-business e-commerce firms, this segment dwarfs the
business-to-consumer sector. Forrester believes that this market, which
totaled $43 billion in 1998, should rise to $1.3 trillion by 2003.
Most companies in this category, like Cisco Systems and
Dell Computer Corporation, have other sales channels, but are increasingly
using the Internet to lower costs and reach a wider customer base. Dell
generates an estimated $30 million in sales every day via the Internet,
while Cisco estimates that it produces approximately $33 million a day in
sales through the Internet.
- Auctions. The online market for auctions is headed
by eBay Inc., (1998 revenues of $86.1 million, with $745 million of gross
merchandise sales).
- Hardware: networking equipment. The hardware sector
provides the infrastructure on which the Internet is built. Hardware
companies provide the equipment that forms the interconnections between the
networks that comprise the Internet. Their products steer traffic through a
spiderweb of routes to the correct destination. One critical piece of
networking equipment is the router, which acts as a traffic officer by
directing data to the proper destination. Another key element of the
Internet infrastructure is a remote access concentrator. Access
concentrators link employees and customers to an organization's internal
network, and link consumers to the Internet via their ISP.
Web Solutions believes that its customers choose its products
and services based on the following criteria:
- Price.
- Experience.
- Reputation.
- Service.
- Accessibility.
Competitive threats come from other ISPs, including the
following companies: Jump.Net, Arizona.Net, AOL, EarthLink, Mindspring, and
Prodigy Internet. Most of our competitors offer solutions for Windows, and
perhaps Mac, but ignore all other operating systems. With the rise of Linux and
other alternative operating systems, there is potential for Web Solutions to
surpass its competitors.
Key competitors are detailed as follows:
Jump.Net
Jump.Net offers a wide variety of services to match customer
needs. They have split information into two categories:
- Basic service: for customers looking for a simple,
inexpensive way to connect their home or business to the Internet.
- Complete details: for customers who need a custom solution
for unique requirements, Jump.net offers the following services:
Connectivity:
- ADSL & SDSL.
- Modem service.
- ISDN.
- Nationwide access.
Special Services:
- Colocation.
- FTP services.
- Hardware sales.
- Leased lines.
- Telnet-only service.
- Web hosting.
Arizona.Net
Arizona.Net is San Antonio's first and largest ISP. Locally
owned and operated since 1994, Arizona.Net specializes in modem dial-up, ISDN,
dedicated local area network (LAN) access and T1 (a high-speed network link that
transmits data at 1.5 Mbps) to the Internet. Arizona.Net now serves Phoenix, San
Antonio, Houston, Dallas, Spring, Georgetown, Dripping Springs, Bandera, New
Braunfels, and Boerne.
For dialup connections, Arizona.Net uses an all-digital modem
pool consisting of equipment from US Robotics, Ascend, and Livingston. All of
their locations maintain a full 56k modem pool, upgraded to the latest version
of the v.90 standard. These digital modems allow for a more reliable connection,
and enable them to make ISDN connections on the same equipment, so they can
offer 64k ISDN service with all dialup accounts. To make sure that customers can
get to their services, Arizona.Net maintains a no-busy-signal policy.
If customers report a busy signal, Arizona.Net has the ability
to connect as many telephone lines as necessary to relieve the problem.
Currently, none of their locations are having any problems with busy signals.
Arizona.Net maintains multiple separate T3 (a high-speed network link that
transmits data at 45 Mpbs) connections to the Internet backbone through multiple
backbone providers. These separate connections give Arizona.Net more than enough
bandwidth to handle future growth as well as provide the security of
uninterrupted service.
EarthLink
EarthLink helps its members have an enjoyable and productive
Internet experience by providing reliable, unlimited Internet access and Web
hosting services, outstanding technical support, useful information, and
innovative services. Prices are among the lowest in the industry. EarthLink
offers the following services:
- Internet access.
- High-speed access.
- Web hosting.
- EarthLink Sprint bundle.
Mindspring
MindSpring Biz delivers complete Business Internet Solutions
for any small business backed with its award winning service and support. Its
business plans--whether Web Hosting, e-commerce, high speed dedicated access, or
Web Design--are packaged to fit customer needs today and are tailored to grow
along with business for tomorrow. Mindspring offers the following business
solutions:
- Web hosting.
- Business access.
- E-commerce.
- Domain reservation.
- Dedicated access.
- MindSpring dialup access.
- SDSL Waiting Lis.
- Promotional solutions.
- Help desk.
The company recognizes that it is subject to both market and
industry risks. The company's view of its risks, as well as how each is being
addressed, is as follows:
- Regulations. Possible problems caused by a sudden
increase in regulation by local, State, or Federal authorities. One way the
company can reduce this risk is to diversify into several different, but
related, business areas. If one area becomes too heavily regulated it may be
sold and the profit rolled back into the company to bolster the remaining
business or start a new venture.
- Monopolistic pricing. Aggressive or monopolistic
pricing by large or heavily-funded providers. By holding prices down, it
becomes difficult for competitors to "low-ball" the company. By
diversifying, we can protect business in one area by bundling it with
offerings from another area, meeting the needs of the customers and
strengthening their ties to the company.
- Legal matters. Lawsuits stemming from user abuse or
accessibility of pornographic or questionable materials. The courts have
historically classified ISP's as "carriers" unless the ISP made an
incomplete effort to actively filter material posted by or made available to
its users. The company's usage policy clearly states that illegal behavior
will result in termination of service, but we do not otherwise attempt to
control the access of its users or their content, thus maintaining the
company's stance as a "carrier" in the eyes of the law. If the
legal environment should change, the company will modify its policies and
procedures to conform to the prevailing legal environment.
- Technology. Sudden and unexpected shifts in
technology or the popularity of the Internet. The company will maintain an
active research and development effort, as well as ongoing review of
forthcoming technologies from competitors and vendors, in order to stay near
the top of the technological curve. Also, the diversification of the
company's business allows it to respond to shifts in revenue by
redistributing material and personnel into those efforts most likely to
generate the highest return on investment.
The Web Solutions strategy is to achieve name recognition and
attract customers by aggressively pricing its services. Once customers have been
acquired, the company will seek to offer them additional services which will
increase margins and provide them with useful solutions they would not otherwise
find.
The company will also implement a low-cost strategy. This will
be achieved by working to establish and develop agreements with local media
companies to exchange services for discounted advertising and other exposures.
Web Solutions' market strategy is to build on its core portfolio of products and
services using the company's expertise in the ISP industry.
The company will leverage its discounted services to help
provide secondary income streams. For instance, the company plans to launch free
email services, business directories, and other similar services which will
attract current and potential customers to our Web pages. These "page
views" will be used to generate advertising revenue, as well as increase
exposure of our own products and services.
Web Solutions will be able to excel in the market because the
company is small, highly focused, and motivated. The company can respond quickly
to changing opportunities and take advantage of the latest technologies.
The company plans to expand its marketing efforts, service
offerings, and production. It is anticipated that additional services will be
offered and more personnel hired within 30 days of initial capital funding. Web
Solutions plans to capitalize on the following areas of growth:
- High-speed Internet connectivity via DSL, Wireless, and
other technologies.
- Web hosting and design tailored to small, local businesses.
- E-commerce and associated online databases.
Web Solutions is currently the lowest-priced provider in
Phoenix for most commercial services, and its reputation has been consistently
high. Size gives the company a competitive advantage, in that it can see where
the industry is going and move in that direction more quickly than the
competition. This also allows the company to be more efficent at recruiting and
hiring highly creative and talented individuals who tend to shy away from large
"corporate" environments. The company has worked to overcome old
mistakes made by existing ISPs by hiring technically-savvy individuals.
The concentrated marketing activities of Web Solutions focus
on the business mission and are comprehensive in nature. The following
activities are the marketing department's mission:
- Advertising design and placement.
- Public relations schedules and press releases throughout
each year.
- Creation of annual advertorial (advertisement/tutorial)
themes for trade journals and industry conferences.
- Planning and execution of all industry conferences,
including the reservation of space, booths, personnel, messages, literature,
etc.
- Collection, analysis, and internal dissemination of
competitive information.
- Creation and maintenance of all corporate literature.
- Design, maintenance, and monitoring of websites.
- Design and creation of sales support material.
- Collection and dissemination of client testimonials.
To generate sales, the company uses direct marketing, computer
reseller and repair facilities, and high-traffic areas (e.g. store checkout
stands). Currently, several local companies display the company's CD-ROMs at
their checkout stands in the Phoenix area in exchange for free Web hosting.
Marketing initiatives will focus on four areas: Colocation
("Server Hotel") facilities, Web hosting, dialup access, and content
provision. Marketing activities will be concentrated in the following
categories:
- Contact Campaigns. This initiative will encompass
various methods of reaching potential customers to generate interest,
followed by direct mail to the potential customer.
- Print Advertising. Ads will be developed and placed
in several industry publications.
- Trade Shows. The company will participate in
selected local and national shows that will provide an opportunity to
develop exposure. This is a very effective tool in creating awareness and
stimulating lead activity.
- Industry Organizations and Associates. The
recommendation is to join a number of organizations that are relevant to the
company as a whole. This initiative will create awareness of the company
within the industry, and provide networking opportunities.
- Telemarketing Campaign. Telemarketing activities
geared to identify qualified leads, follow-up on sales progress to the
qualified leads, and assurance that new potential contact lists are current
and accurate.
- Promotional GiveAways. This is a traditional way of
advertising a company's name by giving something away. This will be used in
conjunction with community service organization fund-raising efforts and
traditional advertising.
Web Solutions currently has strategic relationships with:
- World Communications for Internet service.
- Phoenix DSL Networks for DSL resale.
- Phoenix Communications for high-speed wireless.
- Internet of Phoenix for dialup connectivity (they
provide wholesale pricing in the Phoenix area).
Web Solutions benefits from these relationships by receiving
very competitive pricing on most of these services, allowing the company to
offer competitive pricing on its services to customers.
The company is currently pursuing an agreement with a local
radio station to provide Web-hosting services which will eventually include
extended email services and dial-up access offered to their listeners under a
co-branding agreement. There have also been discussions about this becoming a
nationwide collaboration between Web Solutions and the stations' parent company,
Jordan's Media.
The company plans to develop community calendaring and
groupware applications for use by the company and the afore-mentioned radio
station. This will provide a simple, useful tool for organizations, businesses,
and individuals to organize, plan, announce, and track projects and events. This
is being based on the Open Source project maintained at www.opendesk.com and
will most likely be developed to contain both Open Source and proprietary
components.
In the future, the company plans to partner with backbone
providers, wholesale carriers, and other strategic organizations to:
- Reduce cost of goods and services utilized.
- Increase the number and variety of goods and services
offered to customers.
- Chart the growth of the company into new territories.
At this time, the company is establishing re-seller agreements
with DSL and Wireless high-bandwidth providers, and other services which will
allow the company to compete in these markets, thus allowing for broader
consumer recognition.
The company's management philosophy is based on responsibility
and mutual respect. Web Solutions has an environment and structure that
encourages productivity and respect for customers and fellow employees. The
company's goal is to create an environment where:
- Creativity can flourish.
- Generating new ideas and products is well rewarded.
- Management structure is relatively flat and communication
is encouraged.
- Mutual respect and sharing of knowledge is encouraged.
| Personnel
Plan |
| |
2000 |
2001 |
2002 |
| Donald
Williams |
$30,000 |
$30,000 |
$40,000 |
| Amy
Williams |
$30,000 |
$30,000 |
$40,000 |
| Geena
James |
$36,000 |
$45,000 |
$45,000 |
| Dialup
Services Manager |
$45,000 |
$55,000 |
$65,000 |
| R
& D Manager |
$60,000 |
$60,000 |
$70,000 |
| R
& D Researcher |
$60,000 |
$60,000 |
$70,000 |
| Technical
Support Personnel |
$31,200 |
$31,200 |
$31,200 |
| Technical
Support Personnel |
$15,600 |
$31,200 |
$31,200 |
| Total
People |
8 |
8 |
8 |
| Total
Payroll |
$307,800 |
$342,400 |
$392,400 |
Web Solution's management is highly experienced and qualified.
Key members of its management teams are listed below.
- Donald Williams - President
- Amy Williams - Secretary
- Geena James - Treasurer
This section presents our financial projections for the term
of the plan.
The sales forecast chart and table are presented below. Final
sales forecasts are based on predictions mentioned in the Executive Summary.
Sales
Monthly

Click to Enlarge
The company is raising $1.5 million for the purpose of growth
and operations. This funding will cover operating expenses and product
development during this period. The following is a breakdown of how the funds
will be used.
|
Expenses:
|
Costs: |
| Advertising |
$50,000 |
|
Legal Fees
|
$10,000 |
| Office |
$40,000 |
| Working Capital |
$100,000 |
| Miscellaneous |
$50,000 |
| Sub-total |
$250,000 |
| Product Development: |
$1,250,000 |
| Total |
$1,500,000 |
Significant Assumptions
- Nature and Limitation of Projections. This financial
projection is based on sales volume at the levels described in the revenue
section and presents, to the best of management's knowledge and belief, the
company's expected assets, liabilities, capital, revenues, and expenses. The
projections reflect management's judgement of the expected conditions and
its expected course of action, given the hypothetical assumptions.
- Revenues. The company's revenue is derived primarily
from subscriptions. Revenue projections are based on the 1999 sales in the
comparable market nationwide, based on industry average. The exact numbers
can be found in the Sales Forecast table and chart section.
- Expenses. The company's expenses are primarily those
of salaries, sales commissions, and administrative costs. Other expenses are
based on management's estimates and industry averages.
The table below outlines the general assumptions of Web
Solutions.
| General
Assumptions |
| |
2000 |
2001 |
2002 |
| Plan
Month |
1 |
2 |
3 |
| Current
Interest Rate |
10.00% |
10.00% |
10.00% |
| Long-term
Interest Rate |
10.00% |
10.00% |
10.00% |
| Tax
Rate |
25.42% |
25.00% |
25.42% |
| Sales
on Credit % |
15.00% |
15.00% |
15.00% |
| Other |
0 |
0 |
0 |
The following table and chart reflect the company's break-even
estimates. These are based on fixed and variable cost estimates derived from
past income statement data. Given that Web Solutions has little in the way of
marginal costs, the break even analysis reflects the industry's high gross
margins. Unless one of the potential future risks seriously impacts
profitability, or the company loses its ability to rapidly adjust to changing
market conditions, the company does not see this as a serious issue.
| Break-even
Analysis: |
| Monthly
Units Break-even |
41,368 |
| Monthly
Revenue Break-even |
$41,368 |
| |
|
| Assumptions: |
|
| Average
Per-Unit Revenue |
$1.00 |
| Average
Per-Unit Variable Cost |
$0.05 |
| Estimated
Monthly Fixed Cost |
$39,228 |
Web Solutions is in the early stage of development, thus
initial projections have only been made on accounts that are believed to most
drive the income statement. The following table provides Web Solution's
projected income statements for 2000-2002.
| Pro
Forma Profit and Loss |
| |
2000 |
2001 |
2002 |
| Sales |
$1,500,000 |
$4,500,000 |
$7,500,000 |
| Direct
Cost of Sales |
$77,596 |
$84,296 |
$88,796 |
| Other |
$0 |
$0 |
$0 |
| |
------------ |
------------ |
------------ |
| Total
Cost of Sales |
$77,596 |
$84,296 |
$88,796 |
| Gross
Margin |
$1,422,404 |
$4,415,704 |
$7,411,204 |
| Gross
Margin % |
94.83% |
98.13% |
98.82% |
| Expenses: |
|
|
|
| Payroll |
$307,800 |
$342,400 |
$392,400 |
| Sales
and Marketing and Other Expenses |
$41,468 |
$41,468 |
$41,468 |
| Depreciation |
$0 |
$0 |
$0 |
| Legal
Fees |
$300 |
$300 |
$300 |
| Utilities |
$3,600 |
$3,600 |
$3,600 |
| Insurance |
$4,200 |
$4,200 |
$4,200 |
| Mortgage |
$67,200 |
$67,200 |
$67,200 |
| Payroll
Taxes |
$46,170 |
$51,360 |
$58,860 |
| Other |
$0 |
$0 |
$0 |
| |
------------ |
------------ |
------------ |
| Total
Operating Expenses |
$470,738 |
$510,528 |
$568,028 |
| Profit
Before Interest and Taxes |
$951,666 |
$3,905,176 |
$6,843,176 |
| Interest
Expense |
$65,506 |
$51,131 |
$36,131 |
| Taxes
Incurred |
$225,583 |
$963,511 |
$1,730,124 |
| Net
Profit |
$660,577 |
$2,890,534 |
$5,076,921 |
| Net
Profit/Sales |
44.04% |
64.23% |
67.69% |
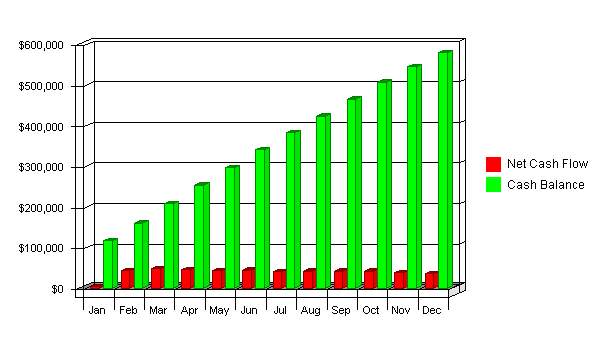
This chart and table show our cash flow and cash balance
projections.
Cash
Click to Enlarge
| Pro
Forma Cash Flow |
| |
2000 |
2001 |
2002 |
| |
|
|
|
| Cash
Received |
|
|
|
| Cash
from Operations: |
|
|
|
| Cash
Sales |
$1,275,000 |
$3,825,000 |
$6,375,000 |
| Cash
from Receivables |
$220,905 |
$619,810 |
$1,069,810 |
| Subtotal
Cash from Operations |
$1,495,905 |
$4,444,810 |
$7,444,810 |
| |
|
|
|
| Additional
Cash Received |
|
|
|
| Sales
Tax, VAT, HST/GST Received |
$0 |
$0 |
$0 |
| New
Current Borrowing |
$0 |
$0 |
$0 |
| New
Other Liabilities (interest-free) |
$0 |
$0 |
$0 |
| New
Long-term Liabilities |
$0 |
$0 |
$0 |
| Sales
of Other Current Assets |
$0 |
$0 |
$0 |
| Sales
of Long-term Assets |
$0 |
$0 |
$0 |
| New
Investment Received |
$0 |
$0 |
$0 |
| Subtotal
Cash Received |
$1,495,905 |
$4,444,810 |
$7,444,810 |
| |
|
|
|
| Expenditures |
2000 |
2001 |
2002 |
| Expenditures
from Operations: |
|
|
|
| Cash
Spending |
$48,141 |
$121,571 |
$194,346 |
| Payment
of Accounts Payable |
$829,560 |
$1,438,462 |
$2,179,741 |
| Subtotal
Spent on Operations |
$877,701 |
$1,560,033 |
$2,374,086 |
| |
|
|
|
| Additional
Cash Spent |
|
|
|
| Sales
Tax, VAT, HST/GST Paid Out |
$0 |
$0 |
$0 |
| Principal
Repayment of Current Borrowing |
$0 |
$0 |
$0 |
| Other
Liabilities Principal Repayment |
$0 |
$0 |
$0 |
| Long-term
Liabilities Principal Repayment |
$150,000 |
$150,000 |
$150,000 |
| Purchase
Other Current Assets |
$0 |
$0 |
$0 |
| Purchase
Long-term Assets |
$0 |
$0 |
$0 |
| Dividends |
$0 |
$0 |
$0 |
| Subtotal
Cash Spent |
$1,027,701 |
$1,710,033 |
$2,524,086 |
| |
|
|
|
| Net
Cash Flow |
$468,204 |
$2,734,777 |
$4,920,724 |
| Cash
Balance |
$580,816 |
$3,315,593 |
$8,236,316 |
The following table outlines Web Solution's projected balance
sheets for fiscal years 2000-2002.
| Pro
Forma Balance Sheet |
| |
|
|
|
| Assets |
|
|
|
| Current
Assets |
2000 |
2001 |
2002 |
| Cash |
$580,816 |
$3,315,593 |
$8,236,316 |
| Accounts
Receivable |
$27,595 |
$82,785 |
$137,975 |
| Other
Current Assets |
$34,650 |
$34,650 |
$34,650 |
| Total
Current Assets |
$643,061 |
$3,433,028 |
$8,408,941 |
| Long-term
Assets |
|
|
|
| Long-term
Assets |
$331,650 |
$331,650 |
$331,650 |
| Accumulated
Depreciation |
$0 |
$0 |
$0 |
| Total
Long-term Assets |
$331,650 |
$331,650 |
$331,650 |
| Total
Assets |
$974,711 |
$3,764,678 |
$8,740,591 |
| |
|
|
|
| Liabilities
and Capital |
|
|
|
| Current
Liabilities |
2000 |
2001 |
2002 |
| Accounts
Payable |
$32,409 |
$81,842 |
$130,835 |
| Current
Borrowing |
$90,338 |
$90,338 |
$90,338 |
| Other
Current Liabilities |
$90,338 |
$90,338 |
$90,338 |
| Subtotal
Current Liabilities |
$213,084 |
$262,517 |
$311,510 |
| |
|
|
|
| Long-term
Liabilities |
$495,975 |
$345,975 |
$195,975 |
| Total
Liabilities |
$709,059 |
$608,492 |
$507,485 |
| |
|
|
|
| Paid-in
Capital |
$0 |
$0 |
$0 |
| Retained
Earnings |
($394,925) |
$265,652 |
$3,156,186 |
| Earnings |
$660,577 |
$2,890,534 |
$5,076,921 |
| Total
Capital |
$265,652 |
$3,156,186 |
$8,233,107 |
| Total
Liabilities and Capital |
$974,711 |
$3,764,678 |
$8,740,591 |
| Net
Worth |
$265,652 |
$3,156,186 |
$8,233,107 |
Standard business ratios are shown in this table. Industy
Profile ratios are based on Standard Industrial Classification (SIC) Index code
7375.
| Ratio
Analysis |
| |
2000 |
2001 |
2002 |
Industry
Profile |
| Sales
Growth |
21.21% |
200.00% |
66.67% |
9.70% |
| |
|
|
|
|
| Percent
of Total Assets |
|
|
|
|
| Accounts
Receivable |
2.83% |
2.20% |
1.58% |
25.00% |
| Inventory |
0.00% |
0.00% |
0.00% |
5.30% |
| Other
Current Assets |
3.55% |
0.92% |
0.40% |
46.30% |
| Total
Current Assets |
65.97% |
91.19% |
96.21% |
76.60% |
| Long-term
Assets |
34.03% |
8.81% |
3.79% |
23.40% |
| Total
Assets |
100.00% |
100.00% |
100.00% |
100.00% |
| |
|
|
|
|
| Current
Liabilities |
21.86% |
6.97% |
3.56% |
49.40% |
| Long-term
Liabilities |
50.88% |
9.19% |
2.24% |
21.20% |
| Total
Liabilities |
72.75% |
16.16% |
5.81% |
70.60% |
| Net
Worth |
27.25% |
83.84% |
94.19% |
29.40% |
| |
|
|
|
|
| Percent
of Sales |
|
|
|
|
| Sales |
100.00% |
100.00% |
100.00% |
100.00% |
| Gross
Margin |
94.83% |
98.13% |
98.82% |
0.00% |
| Selling,
General & Administrative Expenses |
50.52% |
33.89% |
30.75% |
78.10% |
| Advertising
Expenses |
1.67% |
0.56% |
0.33% |
0.90% |
| Profit
Before Interest and Taxes |
63.44% |
86.78% |
91.24% |
1.90% |
| |
|
|
|
|
| Main
Ratios |
|
|
|
|
| Current |
3.02 |
13.08 |
26.99 |
1.57 |
| Quick |
3.02 |
13.08 |
26.99 |
1.19 |
| Total
Debt to Total Assets |
72.75% |
16.16% |
5.81% |
70.60% |
| Pre-tax
Return on Net Worth |
333.58% |
122.11% |
82.68% |
4.10% |
| Pre-tax
Return on Assets |
90.92% |
102.37% |
77.88% |
13.80% |
| |
|
|
|
|
| Additional
Ratios |
2000 |
2001 |
2002 |
|
| Net
Profit Margin |
44.04% |
64.23% |
67.69% |
n.a |
| Return
on Equity |
248.66% |
91.58% |
61.66% |
n.a |
| |
|
|
|
|
| Activity
Ratios |
|
|
|
|
| Accounts
Receivable Turnover |
8.15 |
8.15 |
8.15 |
n.a |
| Collection
Days |
48 |
30 |
36 |
n.a |
| Inventory
Turnover |
0.00 |
0.00 |
0.00 |
n.a |
| Accounts
Payable Turnover |
24.42 |
18.18 |
17.03 |
n.a |
| Payment
Days |
17 |
14 |
17 |
n.a |
| Total
Asset Turnover |
1.54 |
1.20 |
0.86 |
n.a |
| |
|
|
|
|
| Debt
Ratios |
|
|
|
|
| Debt
to Net Worth |
2.67 |
0.19 |
0.06 |
n.a |
| Current
Liab. to Liab. |
0.30 |
0.43 |
0.61 |
n.a |
| |
|
|
|
|
| Liquidity
Ratios |
|
|
|
|
| Net
Working Capital |
$429,977 |
$3,170,511 |
$8,097,432 |
n.a |
| Interest
Coverage |
14.53 |
76.38 |
189.40 |
n.a |
| |
|
|
|
|
| Additional
Ratios |
|
|
|
|
| Assets
to Sales |
0.65 |
0.84 |
1.17 |
n.a |
| Current
Debt/Total Assets |
22% |
7% |
4% |
n.a |
| Acid
Test |
2.89 |
12.76 |
26.55 |
n.a |
| Sales/Net
Worth |
5.65 |
1.43 |
0.91 |
n.a |
| Dividend
Payout |
0.00 |
0.00 |
0.00 |
n.a |