Solving Linear Systems by Graphing


Note 1:A system of two linear equations in two variables x and y consists of two equations of the following form:

Ax+By=C

Dx+Ey=F

Checking Solutions of a Linear System

Note 2:A solution of a system of linear equations in two variables is an ordered pair that satisfies each equation. In other words, the ordered pair must be able to plug in to each of the equations and work properly.


You must first be able to check to see if ordered pairs are solutions of a set of equations. Graphing will come later.

Example 1: Q: Check whether (a) (2,2) and (b) (0,-1) are solutions of the following system:

3x-2y=2

x+2y=6

A: 3(2)-2(2)=2

2+2(2)=6

Both of the equations work for the first point (2,2) because you plug (2,2), which is interpreted as (x,y), into both of the equations and the math works out properly to equal each other. Therefore, since (2,2) works in both equations, it is a solution of the system.

For the second ordered pair the same process is repeated. The point (0,-1) is plugged into the equation and is solved for equality.

A: 3(0)-2(-1)=2

0+2(-1)=-2

While equation one checks out and solves correctly, equation two does not. As a result, the second ordered pair is not a solution of the system of equations. The second equation ends up solving as -2 and not the six that is necessary to obtain a solution of the system.

Solving a System Graphically

Solving a sysem graphically is done through the use of a graphing calculator, the most common and preferred being the Texas Instruments (TI) series calculators. The following steps are for the TI-83 and TI-84 calculators.

Step 1: Go to the Y= button on the calculator and enter the two equations as Y1 and Y2 . Say for instance:

Eq 1: Y=5x+3

Eq 2: Y=2x+5

Step 2: Push the GRAPH button of the calculator.The graph of the two lines should appear.

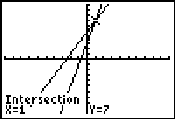
Step 3: Then push 2nd calc, which is the trace function and choose number 5, which is intersect. Proceed to push enter 3 times, which will display the point of intersection. This is shown in the graph to the right.

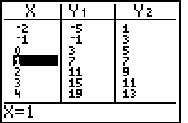
*The table to the right shows the point of intersection as it will be shown using the table function, if chosen to do so.

Note: The two equations must be put in slope intercept form in order to be entered into the calculator.


Back