Online Equation Grapher | gCalcD
Welcome to the gCalcD Online 2D Equation Grapher, the Only Equation Grapher on the Web that Can Graph Any (Well-Defined) Equation
To use this Equation Grapher, select Cartesian or Polar Coordinate System.
■ To graph an equation type in its expression and press Draw Graph (or Enter on the keyboard).
■ To graph two or more equation on the same coordinate plane first press Draw Multiple Graphs.... Quick Start / Syntax
Also find out how to change the scales, translate the origin and rotate the axes by using your mouse; and how to change the colours.
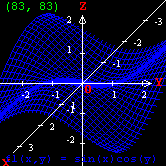
Two-Variable Function Grapher :
What is the graph of a function?
x = 3y^2-4y-2 parabola (Cartesian)
x^2-3xy-2y^2+4x+2y-2 = 0 hyperbola (Cartesian)
sin(2x) = sin(2y) Graph it!
sin(x) = sin(xy) Graph it!
sin(y) = sin(4x) Graph it! (polar)
4sin(r) = 3cos(4θ) Graph it! (polar)
sin(θ) = rcos(θ)^2 parabola (polar)
Fantastic graphers from gCalcD: Function Grapher Equation Grapher Parametric Grapher Point Set Plotter
π: Ctrl+P or
Alt+P or pi.
∞: Ctrl+8
or Alt+8 or infinity.
θ: Ctrl+T or
Alt+T or theta. You can also use x instead of θ; it will be
replaced by θ when you press Draw Graph or Enter on the keyboard.