"The first principal is not to fool yourself. And you are the easiest person to fool." - Richard Feynman, Nobel Laureate.
Sometimes a little analysis of a problem can show how our intuition can be fooled. The following problem was presented to a group of second-year medical students. Don't feel bad if you don't get the right answer. Over half of them didn't either.
Conditional probability uses a funny notation that looks like this: P(A|B). In plain English it reads: The probability of event A happening given that event B has already happened. This assumes there is some connection between event A and B. For example, A could be the probability that you passed the exam and B could be the probability that you studied. The important thing to remember is that the probability that you passed, given that you studied P(A|B) does not necessarily equal the probability that you studied, given that you passed P(B|A).
The following problem about medical test probabilities tries to show that two conditional probabilities that seem equal are quite different.
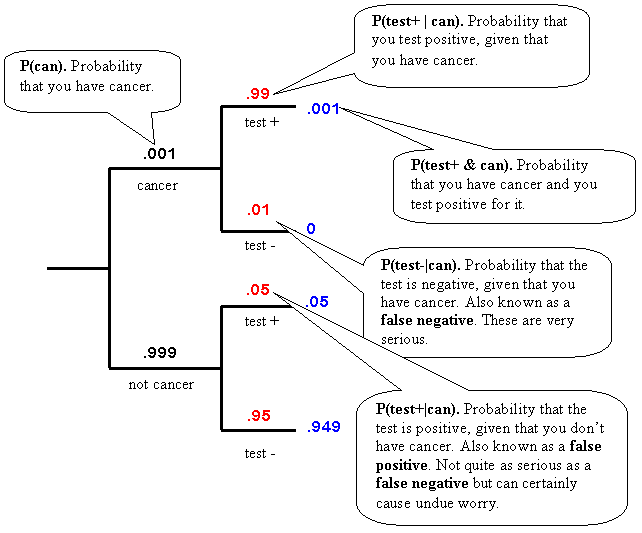
A doctor gives a test to a patient she suspects might have cancer. From experience, the doctor knows that only 1 person in 1000 has cancer, P(.001). In 99% of the cases when a patient does have cancer the test for it is positive. And in 95% of the cases when the patient does not have cancer the test is negative.
The question that was presented to the medical students was this: If the test turns out to be positive, what are the chances the patient has cancer. Over half of the students said that there was a greater than 50% chance of the patient having cancer. They weren't even close.
To see why, it's easier to draw a graph of the possible outcomes. The forward graph, shown below, starts from the left and shows the probabilities of either having cancer P(.001) or not having cancer P(.999). Following the top part of the graph, the patient can either test positive or negative if they have cancer. The probability of testing positive given that they have cancer P(test+|can) is .99. That number, along with the other conditional probabilities, is shown in red. The blue number is the intersection of the two events which is just the black and red number multiplied together.

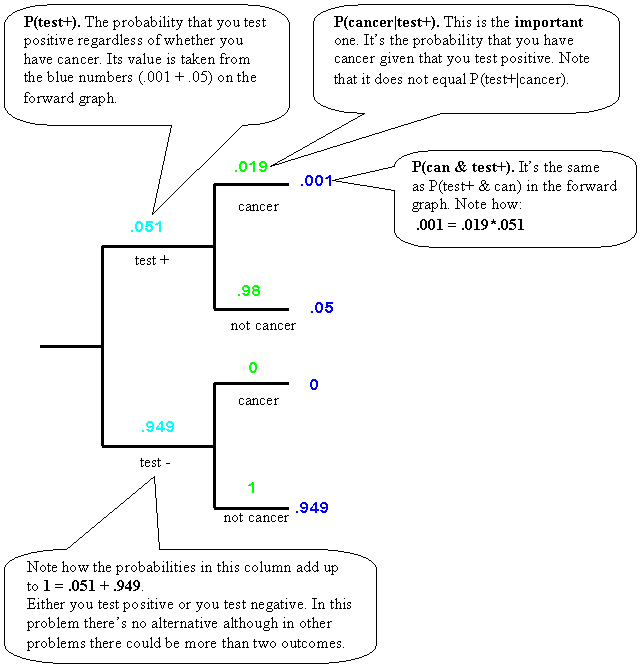
So we've got the probability of a positive test, given that the patient has cancer P(test+|can). But we want to know the opposite. What is the probability that the patient has cancer, given that the test is positive P(can|test+). We can do that by constructing a reverse graph like the one shown below. The difference in the reverse graph is that it starts out not with whether the patient has cancer, but whether they tested positive or not.

Only now can we see that the probability of having cancer if the patient tested positive P(can|test+) is about 1.9%. That's not nearly as high as the 50% guessed by the students, although it's certainly a number to be taken seriously by the physician.
One reason that some people are led astray in reasoning this problem is that the test for cancer is very accurate. While true, the thing to keep in mind is that the incidence of cancer (0.1%) is much smaller than the inaccuracy of the test (1%).
There is a nice equation on conditional probability that looks like this:
P(A&B) = P(A) * P(B|A) = P(B) * P(A|B)
It says that the intersection of probability A and B, P(A&B), is equal to the probability of A, P(A), multiplied by the probability of B, given A, P(B|A). This quantity also equals the probability of B multiplied by the probability of A, given B. Note also that P(A&B) = P(B&A).