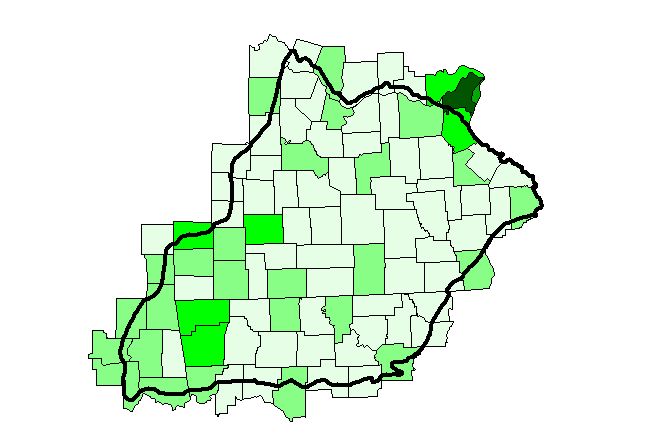
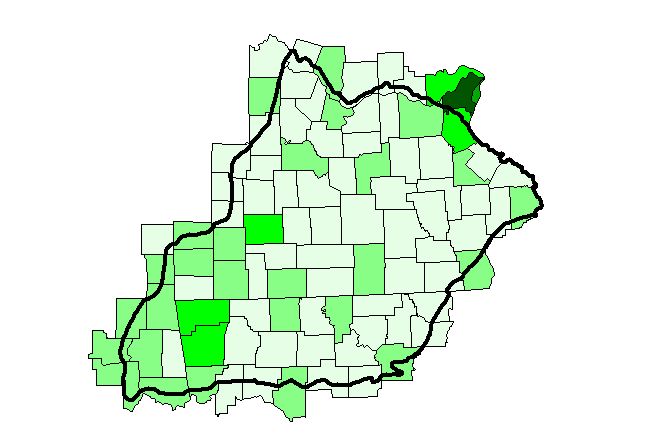
Darker green the higher population
This map shows the population under 5 years old in 1990.
This map shows the population 5 to 17 years old
in 1990.

This map shows the population 18 to 29 years old in 1990.

This map shows the population 30 to 49 years old in 1990.

This map shows the population 50 to 64 years old in 1990.
This map shows the population 65 + years old
in 1990.