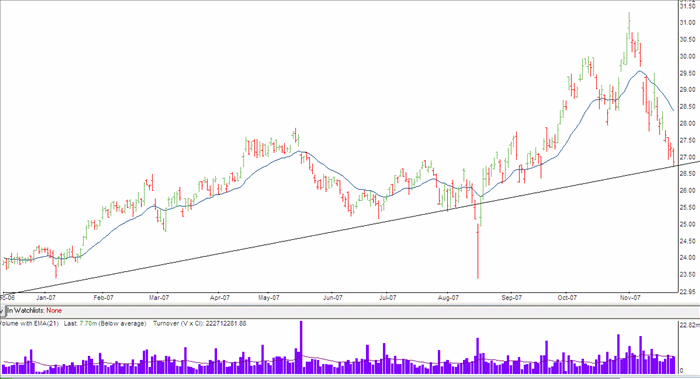
End of Week 2
Well, this past trading week (5 days) the stock came down to the trend line as expected. The next thing we need to see is a change of direction, with the stock "bouncing" off the line as it has done in the past. If this happens, we would hope to see a rise in volume as well, as further confirmation that the market has changed direction. If more shares are being traded it indicates a definite move. At the current point, the stock is still headed down and may actually go past the trendline, so we need to wait. To trade long (upwards) now is likened to catching a falling knife. It's better to wait for it to stop falling so we don't get wounded. So, we'll see what happens next week.

The Moving Average
As I'm using the moving average as part of this trade, I'll explain how. The trade I'm expecting to do is a straight-up stock trade. I'm theoretically going to buy 1000 shares and hopefully sell them at a higher price at a later date. The timeframe for this trade is anywhere up to a month or two, depending on what the stock does.
As explained, I have my trend line in place. The moving average gives me an added level of safety. Sure, the stock might rebound off the trend-line on higher volume, but I want further confirmation. The M/A is one way I can get this. With my timeframe, a 21 period M/A is suitable. This means that at the end of the day, the charting program calculates the average price over the last 21 days and plots it on the chart. It does this each day. The plotted points are joined and the result is the curvy line. If I were trading shorter term, as with options or CFD's, I would choose a faster M/A such as a 9 period.
If the stock does move off the line, I'm going to wait for it to close (the last traded price for the day) above the M/A, and hopefully on higher volume. Once it does this and if all else looks O.K., I can take a position. You can see on the chart how sometimes the stock will retreat to the M/A and bounce off it, just like it does with the trend line. It does this in both directions, so I'm waiting for it to breach the M/A on the upside.
You may be looking at the chart and thinking, "Well, if it rebounds off the M/A, couldn't we just use it instead of the trendline?". Yes, you can look at the chart and see how the stock has behaved before in relation to any particular indicator, and make your own trading system. You would then need to test it in real time to see how it performs. This trendline/ volume/ M/A combination is a trading system. You might make a system based on an M/A/ volume/ bollinger band combination. It's entirely up to you, but would you want to trust your system or one that has already had all the hard work done for you. Thousands of hours of back-testing, plus live market application by numerous traders. MSMI is an educational package, complete with it's own proven, in-built trading system.
No trade at this stage, so let's see what the next week brings.
Week 3

|