

احصاءات Statistics
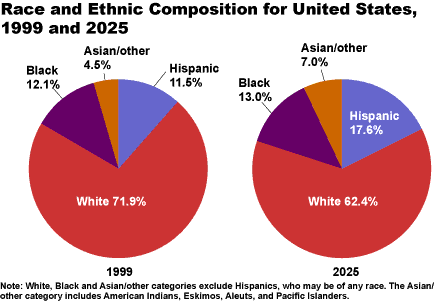
Races in Population
| white | 71.9% |
| Hispanics | 11.5% |
| Black | 12.1% |
| Asians And Others | 4.5% |
| A 1999 Statistic | |




Black and Hispanic Members of Congress,1925-1999 (Includes non-voting members) |
|||||||||||||
Congress |
Year |
Total Black Members | Black Members | Black Members | Total Hispanic Members | Hispanic Members | Hispanic Members | ||||||
| in Congress | of House | of Senate | in Congress | in House** | of Senate | ||||||||
69th |
1925-1927 |
0 |
0 |
0 |
0 |
0 |
0 |
||||||
70th |
1927-1929 |
0 |
0 |
0 |
1 |
0 |
1 |
||||||
71st |
1929-1931 |
1 |
1 |
0 |
0 |
0 |
0 |
||||||
72nd |
1931-1933 |
1 |
1 |
0 |
4 |
4 |
0 |
||||||
73rd |
1933-1935 |
1 |
1 |
0 |
3 |
3 |
0 |
||||||
74th |
1935-1937 |
1 |
1 |
0 |
3 |
2 |
1 |
||||||
75th |
1937-1939 |
1 |
1 |
0 |
3 |
2 |
1 |
||||||
76th |
1939-1941 |
1 |
1 |
0 |
3 |
2 |
1 |
||||||
77th |
1941-1943 |
1 |
1 |
0 |
2 |
1 |
1 |
||||||
78th |
1943-1945 |
1 |
1 |
0 |
3 |
2 |
1 |
||||||
79th |
1945-1947 |
2 |
2 |
0 |
4 |
3 |
1 |
||||||
80th |
1947-1949 |
2 |
2 |
0 |
3 |
2 |
1 |
||||||
81st |
1949-1951 |
2 |
2 |
0 |
3 |
2 |
1 |
||||||
82nd |
1951-1953 |
2 |
2 |
0 |
3 |
2 |
1 |
||||||
83rd |
1953-1955 |
2 |
2 |
0 |
3 |
2 |
1 |
||||||
84th |
1955-1957 |
3 |
3 |
0 |
3 |
2 |
1 |
||||||
85th |
1957-1959 |
4 |
4 |
0 |
3 |
2 |
1 |
||||||
86th |
1959-1961 |
4 |
4 |
0 |
3 |
2 |
1 |
||||||
87th |
1961-1963 |
4 |
4 |
0 |
4 |
3 |
1 |
||||||
88th |
1963-1965 |
5 |
5 |
0 |
5 |
4 |
1 |
||||||
89th |
1965-1967 |
6 |
6 |
0 |
5 |
4 |
1 |
||||||
90th |
1967-1969 |
6 |
5 |
1 |
5 |
4 |
1 |
||||||
91st |
1969-1971 |
11 |
10 |
1 |
6 |
5 |
1 |
||||||
92nd |
1971-1973 |
14 |
13 |
1 |
7 |
6 |
1 |
||||||
93rd |
1973-1975 |
17 |
16 |
1 |
8 |
7 |
1 |
||||||
94th |
1975-1977 |
18 |
17 |
1 |
8 |
7 |
1 |
||||||
95th |
1977-1979 |
18 |
17 |
1 |
7 |
7 |
0 |
||||||
96th |
1979-1981 |
17 |
17 |
0 |
6 |
6 |
0 |
||||||
97th |
1981-1983 |
19 |
19 |
0 |
9 |
9 |
0 |
||||||
98th |
1983-1985 |
21 |
21 |
0 |
12 |
12 |
0 |
||||||
99th |
1985-1987 |
21 |
21 |
0 |
14 |
14 |
0 |
||||||
100th |
1987-1989 |
23 |
23 |
0 |
14 |
14 |
0 |
||||||
101st |
1989-1991 |
24 |
24 |
0 |
14 |
14 |
0 |
||||||
102nd |
1991-1993 |
27 |
27 |
0 |
15 |
15 |
0 |
||||||
103rd |
1993-1995 |
40 |
39 |
1 |
20 |
20 |
0 |
||||||
104th |
1995-1997 |
40 |
39 |
1 |
19 |
19 |
0 |
||||||
105th |
1997-1999 |
40 |
39 |
1 |
20 |
20 |
0 |
||||||
106th |
1999-2000 |
39 |
39 |
0 |
20 |
20 |
0 |
||||||
Sources: |
|||||||||||||
Carmen E. Enciso, Hispanic Americans in Congress, 1822-1995 (Washington, DC: GPO,1995): 135-136. |
|||||||||||||
U.S. Library of Congress, Congressional Resarch Service, "Black Members of the United StatesCongress: |
|||||||||||||
1789-1997," by Mildred Lehmann Amer, Report 97-794 GOV (August 1997): 50-51. |
|||||||||||||
Voting Members of 106th Congress by Race/Ethnicity |
|||||||||||||
Congress |
Black |
Hispanic |
Asian/Pacific Islander |
American Indian |
Non-Hispanic White |
||||||||
106th |
37 |
18 |
5 |
1 |
474 |
||||||||
Sources: |
|||||||||||||
David C. Ruffin, "Black Voters Assert Their Power," Focus 26, no. 12 (December 1998): 3-4, 8. |
|||||||||||||
David A. Bositis, "Black Elected Officials, 1994-1997," Focus 26, no.9 (September 1998): |
|||||||||||||
Trendletter section; Congressional Hispanic Caucus, Inc., accessed online at |
|||||||||||||
http://www.chci.org/hisplinks.html (July 24, 1999). |
|||||||||||||
James S. Lai, ed., 2000 National Asian Pacific American Political Almanac, 9th ed. (Los |
|||||||||||||
Angeles: UCLA Asian American Studies Center, 1999). |