| GOES 12 | GOES 10 |
| Cur | 1947 | X 17 | Ratio 0.280 | 1947 | X 18 | Ratio 0.257 | ||
| Beg | 1929 | C4.5 | 1929 | C4.2 | ||||
| Max | 1937 | M9.8 | Int 1.35e-01 J m-2 | 1937 | M9.0 | Int 1.22e-01 J m-2 | ||
| End | ***** | ***** | ***** | ***** |
| GOES 12 | GOES 10 |
| Cur | 1947 | X 17 | Ratio 0.280 | 1947 | X 18 | Ratio 0.257 | ||
| Beg | 1929 | C4.5 | 1929 | C4.2 | ||||
| Max | 1937 | M9.8 | Int 1.35e-01 J m-2 | 1937 | M9.0 | Int 1.22e-01 J m-2 | ||
| End | ***** | ***** | ***** | ***** |
This GOES X-ray flux plot contains 1 minute averages of solar X-ray output in the 1-8 Angstrom (0.1-0.8 nm) and 0.5-4.0 Angstrom (0.05-0.4 nm) passbands. Data from both operational GOES satellites are included. Some data dropouts will occur during satellite eclipses. SEC alerts are issued at the M5 (5x10E-5 Watts/m2) and X1 (1x10E-4 Watts/m2) levels, based upon 1-minute data. Large X-ray bursts cause short wave fades for HF propagation paths through the sunlit hemisphere. Some large flares are accompanied by strong solar radio bursts that may interfere with satellite downlinks.

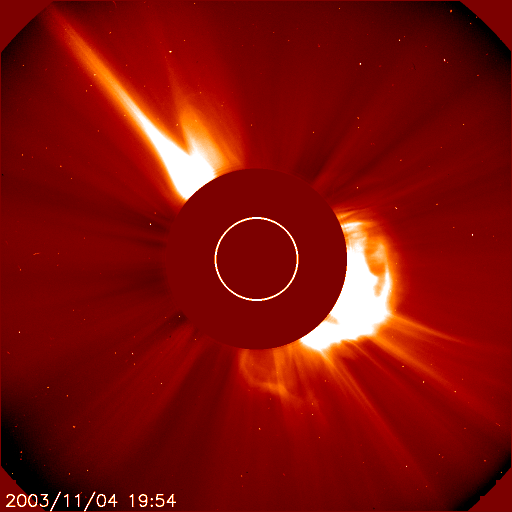
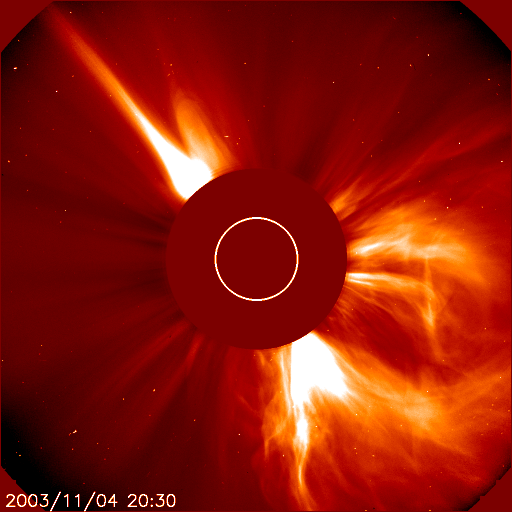
X18.0=Y1.8+ CME aimed to side.