
Developing A Model To Estimate Tornado Wind Speeds From Tree Fall Patterns
Andrew P. Holland
Under the direction of:
Dr. Al Riordan
Dr. Carlyle Franklin
Dr. Jerry Davis
thesis.pdf
Statement of Problem
Tornadoes are arguably one of nature's most destructive forces. They were responible for an average of 91 fatalities per year and over $42,000,000 in total property damage in the U.S. from 1950 to 1994 (NOAA Storm Prediction Center [SPC] 1995). During this time, meteorologists have been trying to better understand the structure of tornadoes. One way to do this is to measure their maximum winds near the surface, a very difficult endeavor because winds from tornadoes destroy most direct measurement devices. To combat the problem, research has been done to estimate tornado wind speeds near the surface from Doppler radar analysis (Zrnic et al. 1985).
Another, and much less expensive and time-consuming, way to estimate tornado maximum wind speeds is to study the damage they produce. The F-scale, proposed by T. Fujita (1981), is a scheme for classification of tornadic wind speed based on the degree of damage that it causes to buildings. By estimating damage severity, one can obtain the approximate wind speed of the tornado and its direction of motion.
The problem with this method is that it can only be used where there are buildings. Thus, there is no simple wind classification scheme that can be used in open areas and those of natural vegetation. However, with knowledge of the types of trees in a forest one can determine the amount of wind the trees cans withstand, and because of the density of targets, one can obtain a detailed damage pattern.
Letzmann (1923, also reviewed by Peterson 1992) suggested that when a tornado moves through a forest it produces a damage pattern that is related to both the wind speed and forward speed of the tornado. By creating a simple, analytical model of a vortex, Letzmann was able to create tree damage patterns and compare them to actual damage patterns and therefore estimate the wind speed and forward speed of a tornado.
Objectives
The goals of this project are to develop a simple objective method to aid in estimating maximum, near-surface tornado wind speeds from damage patterns in forested areas and to produce analyses of tree-fall patterns that can be easily generated by the National Weather Service and damage assessment teams. In support of the goal, the main objective is to create a model that will produce a diagram of the tree-fall pattern when given a number of simple variables such as the maximum rotational wind speed, the maximum inflow (radial) speed, the forward speed, and the radius of the tornado. This model will combine a vortex model based on the combined Rankine vortex and a modified tree model based on the HWIND model designed by Peltola et al. (1999).
Model Description
1. General description
The purpose of this model is to simulate tree damage patterns caused by a tornado moving through a forest. To do this, a model vortex is created and then moved over a model forest. The vortex model is based on the combined Rankine vortex created by combining a rotating, radial and translating wind field. As a first step in model development, the vortex is two-dimensional and steady state, the terrain is considered to be flat and there is no interaction among the trees.
The tree model is based on the mechanistic tree model designed by Peltola et al. (1999). A resistance to stem breakage is calculated for each tree. A resistance to uprooting is not calculated since the TornTree model will only be run for pine trees, which are more likely to suffer stem breakage (Fredericksen et al. 1993; Hedden et al. 1995). A turning moment is then calculated based on the wind speed and tree characteristics. If this turning moment is greater thatn the resistance, the tree's stem is broken.
The user inputs an initial guess of the maximum tangential velocity, the maximum radial velocity, the forward speed and the radius of the tornado. The model will output a graphical file of the vortex and the orientation of the fallen trees.
2. Vortex model
The Rankine vortex is the basis of the vortex model in TornTree. A Rankine vortex consists of two regions. In the inner region, velocity increases linearly with radius to a maximum, while in the outer region it decreases inversely with radius (Fig. 1). Fig. 2 shows the model output of a combined Rankine vortex.
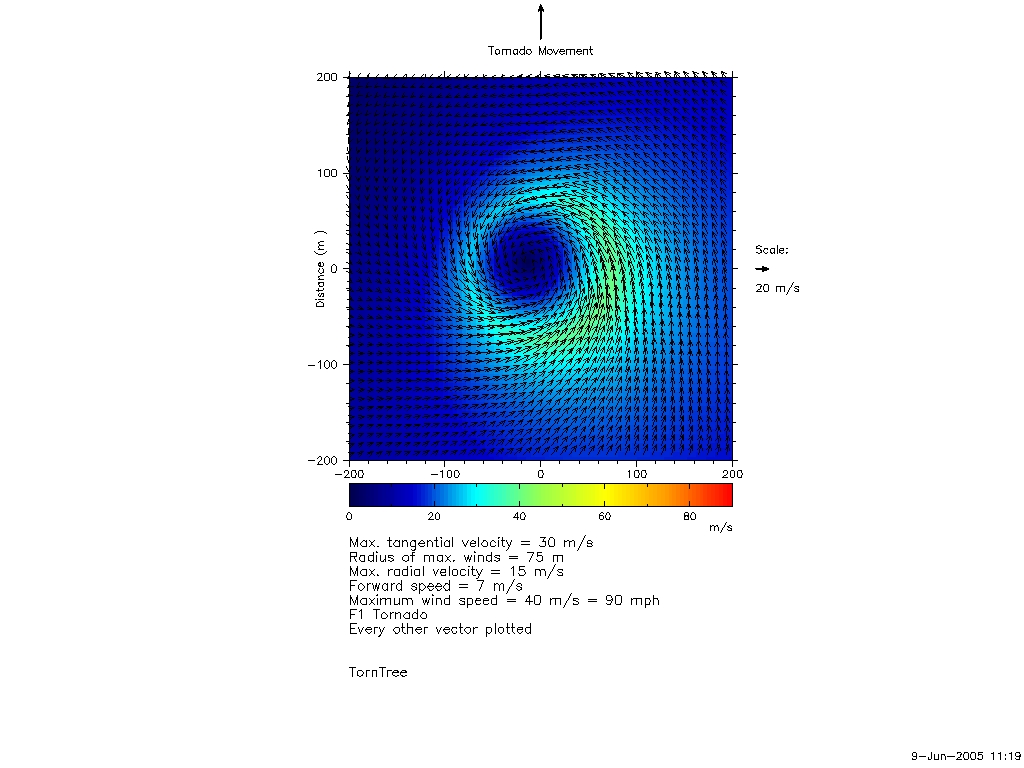
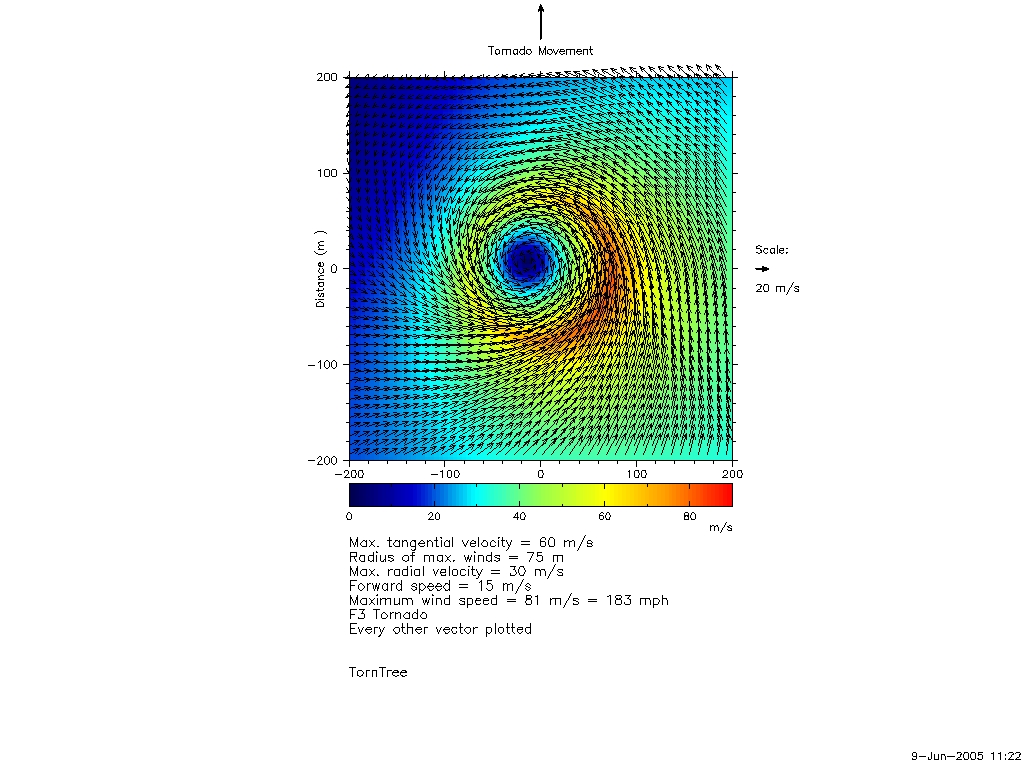
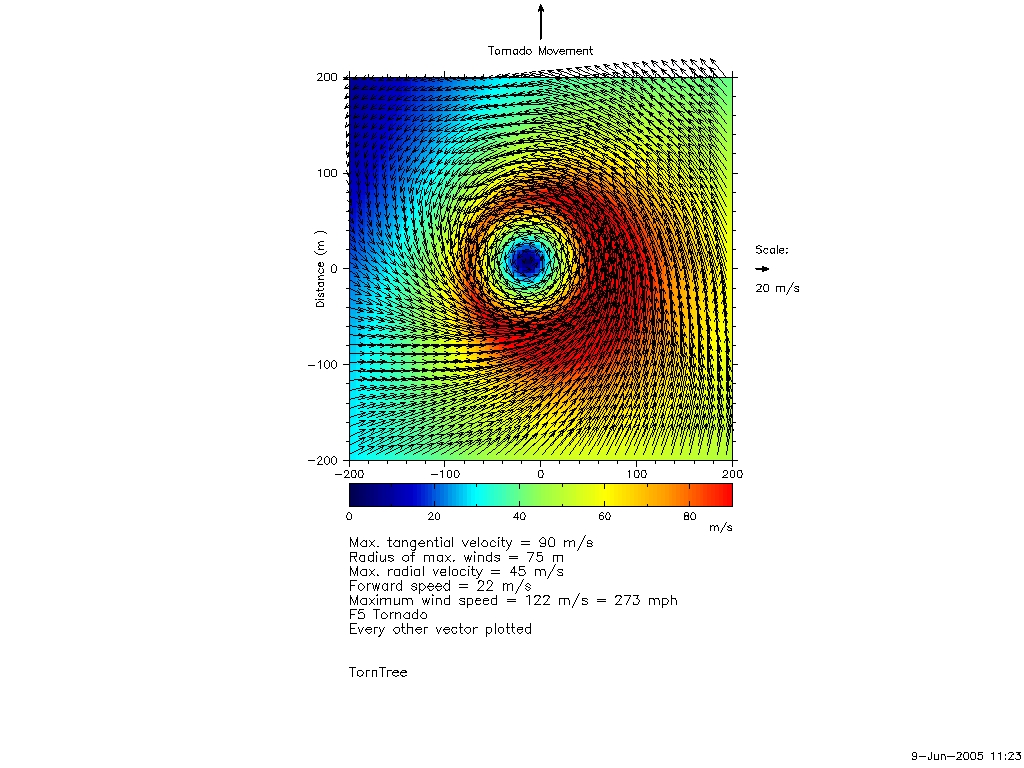
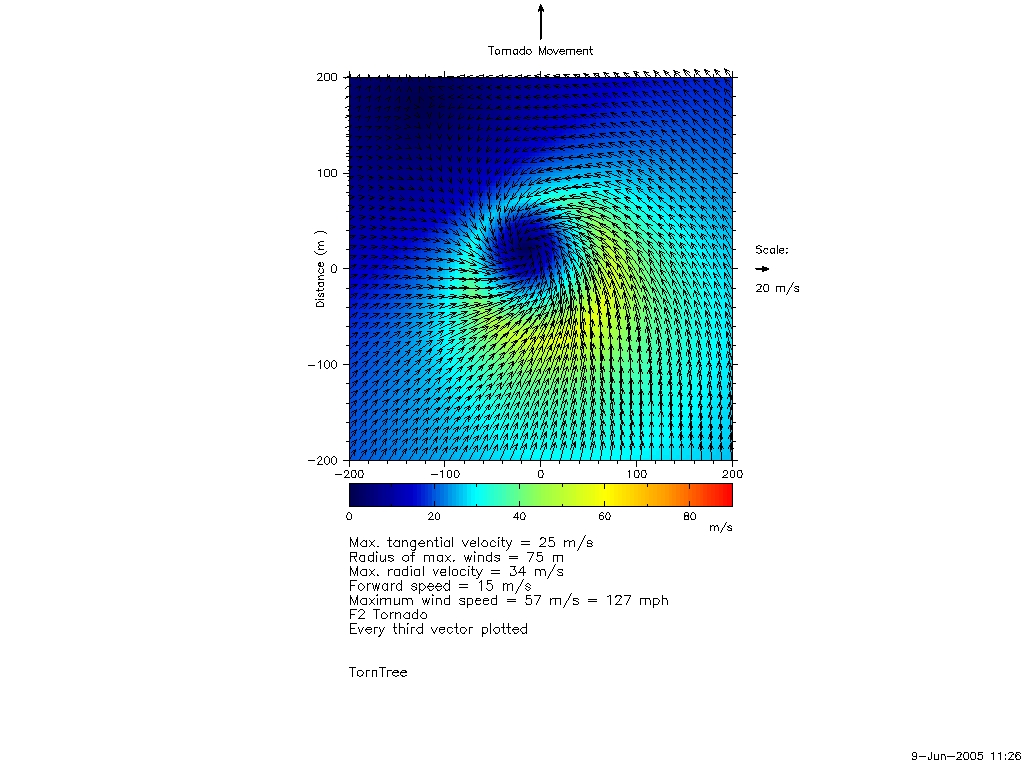
It has been suggested that radial velocity, or inflow, varies with radius in a similar fashion. Adding the tangential and radial velocities produces Fig. 3 to represent the mean wind field for a stationary tornado. Finally, the forward motion is added to the wind field to create a moving tornado (Fig. 4). The wind speed at each grid point is then passed on to the tree model.
3. Tree model
First, each tree is divided into one meter segments. Then the wind speed is calculated at the midpoint of each segment, by using the logarithmic profile Fig. 5. The force of the wind on the tree is calculated for each segment from the wind speed, drag coefficent, density of air and the cross-sectional area of the tree. Since the wind force bends the tree, a force due to gravity becomes important. This is calculated for each segment by multiplying the mass of each segment by gravitational acceleration. The turning moment due to the wind for each segment is the wind force times the height of the midpoint of the segment. The turning moment due to gravity for each segment is the force due to gravity times the horizontal displacement of the stem at that segment's midpoint. The total turning moment is the sum of these moments over the height of the tree (Fig. 6).
The total turning moment calculated above assumes that the tree is at the stand edge and has an infinite open area upwind of it. To correct this, a Gapfactor and Gustfactor are multiplied to the turning moment. The Gustfactor adjusts the turning moment for distance into the stand and the Gapfactor adjusts for a difference in the upwind open area. Fig. 7 is a plot of critical turning moment versus distance into the stand. The critical turning moment increases with distance into the stand, therefore, more wind is needed to knock down the trees. Fig. 8 is a plot of critical wind speed versus upwind gap size. As the upwind gap size increases, less wind is needed to knock down the trees.
A resistance to stem breakage is calculated for each tree using its modulus of rupture and diameter at breast height (1.3m). If the total turning moment is greater than the resistance, the tree's stem is broken.
Results
In order to error check the TornTree model, the model calculates critical wind speeds of Scots pine. These critical wind speeds were then compared with critical wind speeds of Scots pine from the HWIND model. Fig. 9 a. and Fig. 9 b. are plots comparing these results. These critical wind speeds are the mean wind speeds which are 85% of the gusting wind speed (Peltola et al. 1993).
The model is now run for Loblolly pine. The critical wind speeds for Loblolly pine of differing height and taper values are shown in Fig. 10. Taper is the height in meters divided by the diameter at breast height (dbh) in meters. A tree with a large taper and a certain dbh is taller than a tree with the same dbh and a smaller taper. Trees with smaller taper are more resistant to stem breakage.
The data used for loblolly pine in the TornTree model were taken from Wahlenberg (1960)(Table 1). This table includes the height, dbh and spacing for trees age 20 to 80 years in Site Indices of 60 to 120. Site Index is determined for a tree species based on several soil factors relative to that area (Hamilton 1993). The Site Index is the height of 50-year-old dominant trees of the same species in a given index area. Higher Site Indices are associated with higher taper and vise versa. Slower growing trees (low taper) tend to have higher critical wind speeds regardless of height, although, it does appear that shorter trees may have even higher critical wind speeds.
Spacing can also have a large effect on critical wind speed. The model assumes that spacing is equal to crown width. Therefore, tree crowns will meet, but not overlap and will leave no space between trees. The larger the crown the more surface area for the wind to act on, thus increasing the wind force and decreasing critical wind speed (Fig. 11).
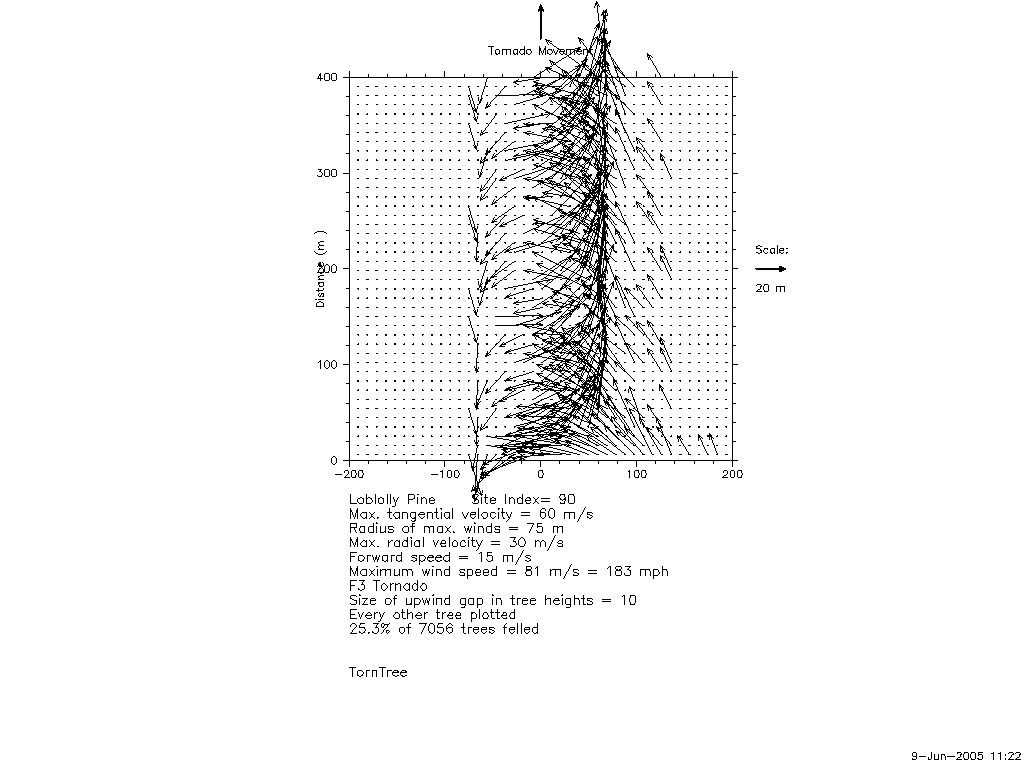
Note: For all of the following plots, the first two plots (the contour and tree fall pattern) are from the TornTree model. The perspective, overhead and graphs were created by importing data from the TornTree model into the Stand Visualization System program designed by the USDA Forest Service.
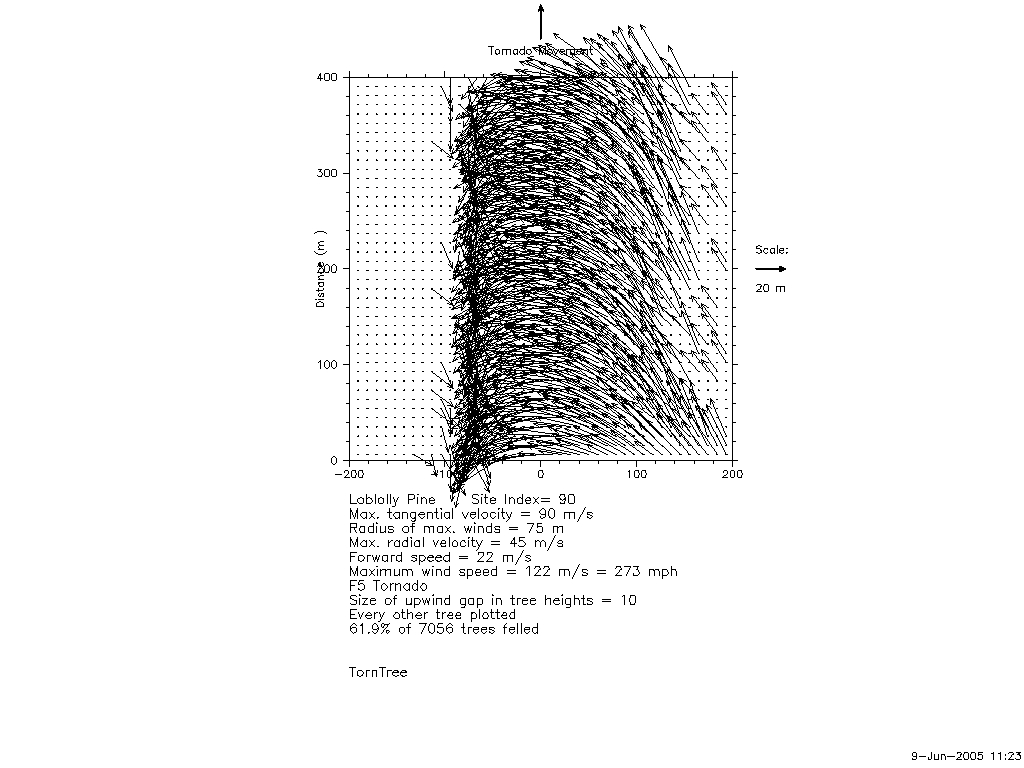
Below are plots of downed Loblolly pines for different F-numbers:
| F1 Tornado | Tree fall pattern | perspective | overhead | graphs |
|---|---|---|---|---|
| F3 Tornado | Tree fall pattern | perspective | overhead | graphs |
| F5 Tornado | Tree fall pattern | perspective | overhead | graphs |
Below are plots of downed Loblolly pines when one input variable is changed at a time:
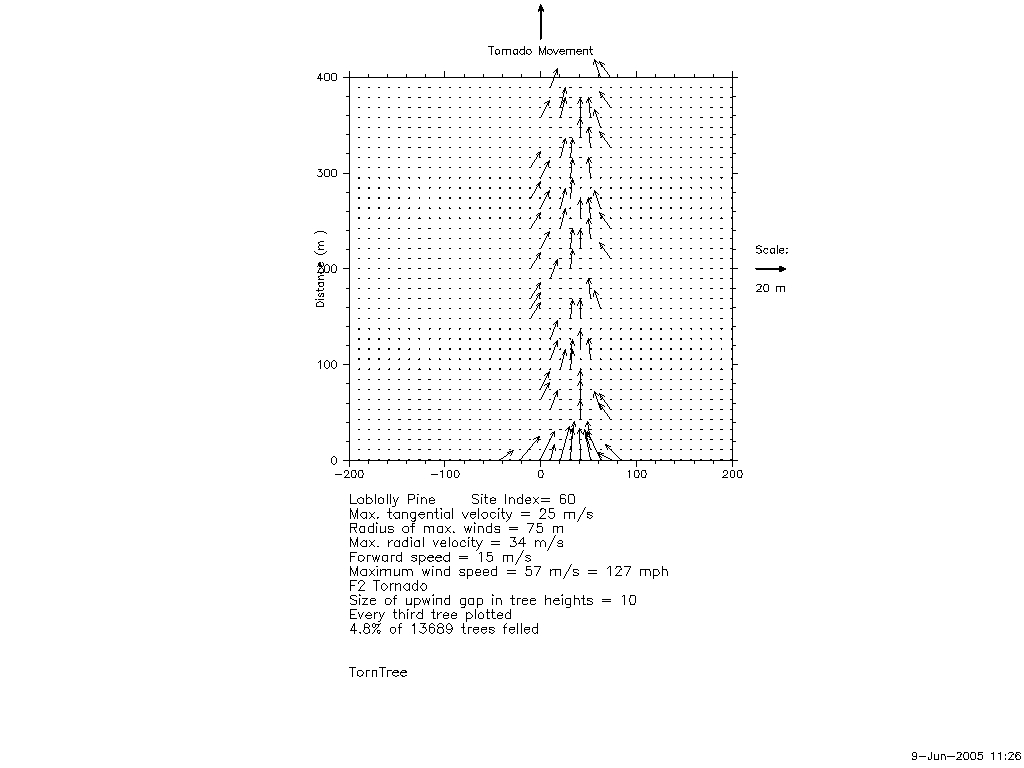
Below are plots of downed Loblolly pines from an F2 tornado with different Site Indicies:
| Site Index 60 | perspective | overhead | graphs |
|---|---|---|---|
| Site Index 90 | perspective | overhead | graphs |
| Site Index 120 | perspective | overhead | graphs |
The TornTree model is also capable of modelling a microburst and moving it through a forest. Below are examples of microbursts when different variables are varied and the tree fall patterns associated with them:
Torntree now works on Windows!!!
Acknowledgements
I would like to give a huge thanks to my wife and daughter who have been very understanding and helpful through the thesis writing process. Thanks to my committe members for all of their advice and guidance. I also received help from far away Finland. Thank you to Dr. Heli Peltola for all of her help with the HWIND model. All of the plots from the TornTree model were created using the PGPLOT library. Thanks also to Ed Bilicki for hiring me before I was done and for giving me time to finish.
Contact: holland6@yahoo.com