|
We're predicting EUR/USD rise to 1.38 - then a Greenspan driven $ rally to
EUR 1.20/24, followed by $ crash to about EUR 1.70/1.80
Timings : 1.38 by end of June 2005 and $ downturn in reaction to Greenspan
driven rally about end of 2005 / early 2006.
Update 21-03-05 : Today was a nice example of the kind of volatility that you
have to take in your stride by being able to survive/avoid significant draw-down. Major Asian players were out of the market
and the institutional fat cats were departing for an extended Easter holiday.
generally speaking, the smaller the number of 'players' in the markets, the
easier it is to manipulate herd behaviour.
Update 12-06-05 : Well how did it go? Euro/USD is 1.2121 - do you think we've
had our "Greenspan driven rally" - earlier than was predicted?
Here are the up to date XAU, CHF, and GOLD charts :
 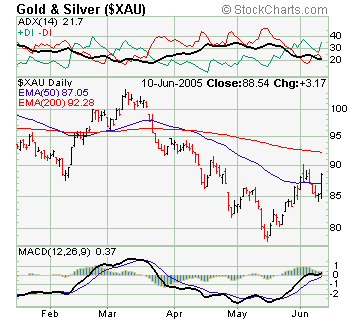

Will the predicted "downturn" also be earlier than predicted? Of one thing we
can be sure that such a ($) rally generates a reaction. Are we seeing it's
beginning in the Euro bear trap following rejection of an neo-con EU
constitution by two of Europe's most sophisticated electorates in France and
Holland?
Interesting times. Are they generating tradable opportunities?
Update 01-04-05: There follows a set of charts, 'snapped' following the
bloodbath that began with the volatility mentioned above that nicely illustrate a
trading strategy that effectively feeds off the behaviour of large finance
oligopolies' "Commercial net Long/Short" ("CNL" and "CNS") positions, 200/50
Moving Averages, the relationships between CHF (Swiss Franc), gold, and XAU
(gold/silver miners' index), and a weather
eye on MACD for +ve or -ve divergence.
The citizen trader, Instead of tackling the impossible task of out researching
the oligopolies, is effectively trading oligopoly behaviour, using the
currencies as proxies.


A simple Moving Averages based trend strategy.
The Criteria: After the currency pair (GBP and
USD in the
example below) cross above both moving averages (10 and 20 day MAs)
for a prolonged period of time you can screen to the next criteria. Draft a
channel set at 2 standard deviations over the price data to test if the
trend is valid. How does one know if the channel is valid? When 95% of
pricing trades within both bands the channel is then considered valid.
Once the criterion has been confirmed, you apply a 10 and 20-day SMA to the
price chart to establish the entry and stop loss price. As time passes you
will notice the gap between the two MAs "wash" to and fro as they oscillate
behind the price. When the two become relatively close to one another, you
have an ideal entry situation.
The Trigger When the two MAs begin to converge you place entry order(s)
at and below the 10-day SMA, laddering to halfway between the two. For
example: if the 10-day SMA was at 1.3220 and the 20-day SMA is at 1.3100 you
would place one order at 1.3220 and another at 1.3160. If the price dips
into your entry orders you place a stop about the size of the spread of the
instrument you are trading below the 20-day SMA. If you are trading a cross with a larger
spread, that gap would increase accordingly. Below is a recent example of
this strategy on the GBP/USD.
Notice as the price converged if you had set orders at and half way
between the distance of the MAs, you would have had various opportunities
of a nice
profitable trade.
A Triple moving-average crossover strategy
Moving average
crossover strategies are designed to generate buy or sell signals when a shorter
period moving average crosses above or below a longer period one. While they are
prone to whipsaws and thus generally not very reliable in the currency markets,
one reasonably more dependable strategy employs three moving averages: the
10-day simple, 20-day exponential, and 30-day exponential.
This triple moving
average crossover strategy is designed to spot trend reversals, and works as
follows: in a downtrend the 10-day moving average will appear below the 20 and
30-day, pulling the other averages lower. On the crossover, these moving
averages should reverse order and separate, with the 10-day appearing above the
20 and 30 day, signalling a possible reversal in trend.
M oving
average crossover strategies are vulnerable to false signals therefore, buy and sell signals should be confirmed by other technical
indicators before entering a trade - the same applies to MA crossover use as a
trend reversal signal.
A
Fundamentals Driven Trading Strategies
Exchange
rate overshooting model as contributor to currencies price volatility
Applied
to the current (18-03-05) price action in EUR/USD, the implication is that the pair could
be due for a pullback when it trades into the 1.25 – 1.28 range
The new highs
being made almost daily in EUR/USD have prompted a variety of explanations for
the move, many of which focus on the current account imbalance and easy monetary
policy in the United States. One description of this extreme price action is
based on the model of exchange rate overshooting, a framework proposed by Rudi
Dornbusch that essentially reinvented the field of international economics when
it was first introduced.
What
is the exchange rate overshooting model?
The exchange rate
overshooting model attempts to explain, among other things, the volatility of
currency price movement. At its core is the assumption that goods market prices
adjust much more slowly than asset market prices (i.e., the price of a
manufactured good sold in the United States will tend to take more time to
change than the price of a bond traded in the market). In this sense, goods
prices are “sticky,” or slow to adjust.
The model can be
described in the following way: Suppose that the supply of money in the economy
rises unexpectedly (say through unforeseen easing by the Fed). In the long run,
money should be neutral, meaning that the resulting inflation should eventually
cause prices to rise and the dollar to depreciate (say against the
euro). Also, as the supply of money increases, the “price” of money—the interest
rate—falls. However, with falling interest rates, investors will have an
incentive to hold bonds only if they are compensated with proportionate dollar
appreciation .
Yet, as stated
before, we know the dollar has to depreciate . So what happens next?
The Dornbusch model implies that the dollar overshoots, depreciating by “too
much” in order to clear the goods market, and then correcting by appreciating,
thus clearing the asset markets.
Why is
this model important? Implications for EUR/USD
The Dornbusch
model implies that in an economy that has fast-clearing asset markets and
slow-clearing goods markets, a rational response to an unforeseen increase in
the money supply (a “monetary shock”) is for the exchange rate to overshoot. As
above, the initial dollar depreciation must exceed or “overshoot” the long-term
depreciation.
This may just be
what is currently happening in the EUR/USD market. As a result of Fed easing,
the EUR/USD rate is adjusting by too great of an amount, overshooting its
appropriate longer-term value. The practical implication is that in the
1.25-1.28 range, there could be the possibility of a pullback, consistent with
what the model would suggest.

To be Contd.
|
