 Introduction...
Deliverables - Action or Recommendation?...
Project Management - QuickStart...
Simple & Effective Quality Tools...
ldrtk999...
ldrtk999...
ldrtk999...
ldrtk999...
Glossary of Team Leadership Terms...
Introduction...
Deliverables - Action or Recommendation?...
Project Management - QuickStart...
Simple & Effective Quality Tools...
ldrtk999...
ldrtk999...
ldrtk999...
ldrtk999...
Glossary of Team Leadership Terms...
Copyright Lark Ritchie 1995. 1996.
These visual tools help individuals and teams sift through data, understand working processes, isolate problems. They are simple effective tools and can be quickly built using Excel, PowerPoint, or a drawing tool. A quick introduction might bring these to mind next time you work through a problem.
The Checksheet
The purpose of a checksheet is to present information as a clear mental image; a grid or graphical format is ideal. This may be presented as a simple listing of items and an associated count or tally value. Another alternative is a picturepresented in the format. The example below reports defects during a period of time, say, for a shift.
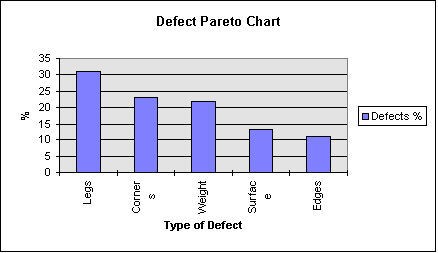
The Pareto Chart
Pareto charts are useful because they identify factors that have the largest effect on the system, screen filtering out the less significant factors. Ideally, this allows the viewer to focus on a few important factors in a set of process performance data.
By plotting the cumulative frequencies (the count of incidients by type), in decending order in a spreadsheet, and graphing the data in a clomun chart, we create the filtering effect that isolates the valuable sets of data. The results are an orderly format, easily comprehended.
The example below quickly identifies "Legs" as having the highest number of incidents for defects.
The Flowchart
Flowcharts are graphical representations of a process. Breaking the process down into its individual steps, flowcharts are useful in identifying where problems might be generated in the system. Click here to see an example of a flowchart. (Back Button returns you here.)
The Cause and Effect Diagram
This diagram, also called an Ishikawa diagram (or fish bone diagram), is used to identify the multiple possible causes of a single effect. (See Below) Thus, for a particular result (called an ‘effect’ – e.g. Commited Employees,) the diagram illustrates and organizes possible causes.

The main line. or backbone represents the effect (the quality attribute that is to be improved and controlled) and is normally labeled on the right side of the diagram. Each major branch of the diagram identifies to a major cause, or type of causes that contributes to the effect. Minor branches identify related causal factors. Fishbone diagrams are useful in any problem determination, because they show the relationships between cause and effect in a simplified presentation. Once contributors to the effect are identified we can work in each causal are to test for sources of the effect.
Example of a Cause and Effect Diagram
Histogram
Histograms present data in a simple, graphic. As well, we can visualize occurrence distributions and dispersion and central tendencies. Most spreadsheet applications can generate histograms from tabulated data
The Scattergram
Scatter diagrams are charts that illustrate the influence that one variable has on another. Usual diagrams of this type usually display points representing the recorded values for one variable plotted against the value of another variable.
The Control Chart
The control chart is the basic graphic of statistical process control (SPC.) It identifies the range of variability in a system (called common cause variation). Control Charts help identify whether or not a process is operating consistently or an exceptional cause has occurred to change a process mean or variance.
The lines of the control chart designate upper and lower control limits that are determined with statistical formulas using data from the process. Data points outside these ranges indicate variations due to exceptional causes, which can usually be identified and eliminated. Improvements to reduce common cause variation usually mean that the process itself must be significantly changed to make gains.
Back To The Managers' ToolKit Intro
Back To The Leaders' ToolKit Intro
Lark's Home Page
Athens
Geocities homepage© 1996 Lark Ritchie. Contact me at this address..