 |
|
|
|
|
|
|
|
|
|
|
|
|
|
|
|
|
|
|
|
|
|
|
|
|
|
|
|
|
|
|
|
|
|
|
|
|
|
|
|
|
|
|
|
4.2 Graphing Linear Equations in Two Variables
|
|
|
|
|
|
|
|
|
|
 |
|
|
|
|
|
|
|
|
|
|
|
|
|
|
|
Goal: To learn to graph linear equations using a table of values.
Monday we learned how to graph equations that had only one variable, either x or y (x = some number or y = some number). Our graphs were either horizontal or vertical lines. Today we will graph equations with both x and y and we will get lines that have a slant (or slope).
We are going to use a table of values to plot a few points and sketch our line. To construct a table of values, I want you to choose at least three x values spread evenly apart. Most of the time I recommend using x = -3, 0, & 3. If the coefficient of x in the equation is a fraction then I recommend using a multiple of the denominator of that fraction instead. For example in the equation y = (1/2)x + 3, I would use a multiples of 2 such as -4, 0, & 4.
|
|
|
|
|
|
|
|
|
|
|
|
|
|
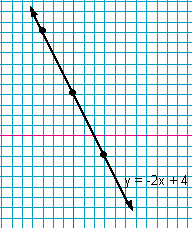
Example 1: Sketch the graph of y = -2x + 4.
|
|
|
|
|
|
|
|
|
|
|
|
|
|
First construct your table of values by drawing your table with three columns; x, y, and y = -2x+ 4.
Fill in the x column with the values you chose ( I chose -3, 0, and 3).
Find the corresponding y-values by substituting each x-value into the equation and solving. Make sure to show each and every step. Put your answers in the y-column.
Now that the table is complete plot the points for the solutions you found. For this example the points are (-3,10), (0,4), and (3,-2).
The points should line up. If they don't you need to find your error.
If they line up, use a straight-edge to draw a line through them.
Make sure to add arrows to the line and label it.
|
|
|
|
|
|

|
|
|
|
|
|
|
|
 |
|
|
|
|
|
|
|
|
|
|
|
|
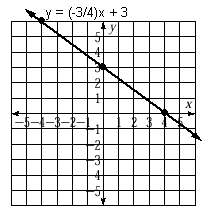
Example 2: Sketch the graph of y = (-3/4)x + 3.
|
|
|
|
|
|
|
|
|
|
|
|
|
|
First construct your table of values by drawing your table with three columns; x, y, and y = (-3/4)x + 3.
Fill in the x column with the values you chose ( I chose -4, 0, & 4 because they are multiples of the denominator of the coefficient of x).
Find the corresponding y-values by substituting each x-value into the equation and solving. Make sure to show each and every step. Put your answers in the y-column.
Now that the table is complete plot the points for the solutions you found. For this example the points are (-4,6), (0,3), and (4,0).
The points should line up. If they don't you need to find your error.
If they line up, use a straight-edge to draw a line through them.
Make sure to add arrows to the line and label it.
|
|
|
|
|
|

|
|
|
|
|
|
|
|
 |
|
|
|
|
|
|
|
 |
|
|
|
|
|
|
|
|
|
|
|
|
|
|
To contact me:
Phone: 972-635-2789
Email: magriesti_rc@yahoo.com
|
|
|
|
|
|