 |
|
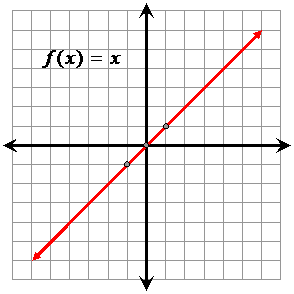
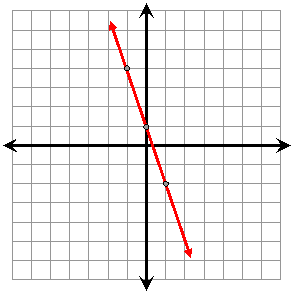
Linear functions are commonly graphed using the slope
intercept form of the equation; y = mx + b.
|
|
Click on "original function" above to compare this graph to the basic absolute value graph. |
|
|
|
Unsure of graphing functions?
Read about graphing using
transformations. |
|


