|
|
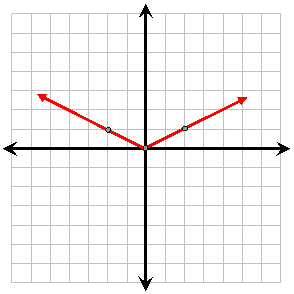
This graph represents the basic
absolute value function compressed vertically. Notice that the
factor in front of the absolute value symbol is a value less than 1. |
|
|
|
|
|
|
|
This graph represents the basic
absolute value function compressed vertically. Notice that the
factor in front of the absolute value symbol is a value less than 1. |
|
|
|
|
|