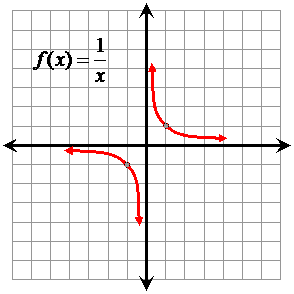
This graph represents the basic reciprocal function shifted horizontally 3 units to the left. The vertical asymptote shifts 3 units to the left as well, while the horizontal asymptote reamains on the x-axis. Notice that the +1 is within the denominator.

The anchor points:
(-1,-1) (1,1) become (-4,-1) (-2,1).
The x components of the coordinates shift 3 units in the negative direction.

Click on "original function" above to compare this graph to the basic reciprocal graph.


A positive number will result in a horizontal shift to the right. Unsure of horizontal shift? Read about graphing using transformations.