Graphing 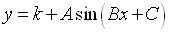 and
and 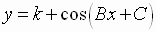
Functions of this form can be graphed by studying the effects of k,
A, B, and C
on the basic graphs of y = sin x and y = cos x.
 and
and 
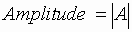
The constant

is called the amplitude of the graph .
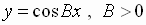
Both graphs are periodic with period  ,
since
,
since
See Example 1, page
478, of the textbook.
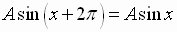
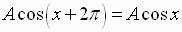
 and
and 
 and
and 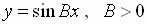 both have amplitude
equal to 1.
both have amplitude
equal to 1.
The period of the sine function is  ,
,
so  completes
one cycle as
completes
one cycle as  varies
from
varies
from
 to
to 
or, in other words, as  varies from
 to
to 
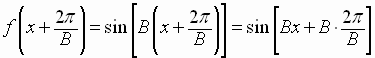
So the period of is

Checking:
If 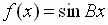 , then
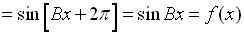
Similarly, the period of
is
See Example 2, page
479, of the textbook.
 and
and 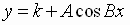
Summarizing
our results so far:
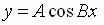
For  or
or 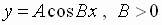
If  ,
,
the basic sine or cosine curve is stretched.
If  ,
,
the basic sine or cosine curve is compressed.
See Examples 3 – 4, pages 480 – 481, of the textbook.
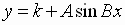
The graphs of and
can be obtained by
translating
the graphs of
and
vertically,
up
 units
units
if
is positive
and
down
 units
units
if
is negative.
and
Since  has period
,
has period
,
must complete one cycle as

varies
from

to
In other words, as
varies
from

to
 has a period of
Its graph is translated
 units to the right if
  is positive
units to the left if
is negative
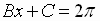
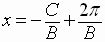
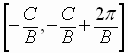
The quantity  is
called the phase shift.
is
called the phase shift.
Similar results apply to 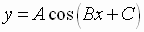
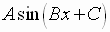
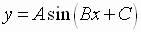
Summary of Properties of y = A sin (Bx + C) and
y = A cos (Bx + C)
For B > 0:
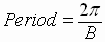
Amplitude =  Period =
  Phase Shift =
The graph completes one full cycle as  varies over the interval
See Examples 6 – 8, pages 485 – 487, of the textbook.
top
next Graphing
General Tangent, Cotangent, Secant, and Cosecant Functions