PlanetView grew out of a desire to experiment with bump-mapping—that is, the technique of shading a flat surface to give the appearance of small height variations. A demonstration of this technique by itself would be rather dull, so I have packaged it as a program that displays information about the moon and some of the planets. This application also provides an opportunity to experiment with Windows controls, especially the IE web browser control.
Return to the portfolio
I successfully implemented the bump-mapping concept, but unfortunately I was never able to get a convincing image of the moon or use the web browser control the way I wanted to. After months with very little progress, I cancelled the project. However, you can download the source code.
Download the source code (zip format)
18 July 2002
In order to make the program work, I need height and color data for various planets. This data is available from NASA's Jet Propulsion Laboratory and its affiliates. For example, the following image shows the topography of the moon:
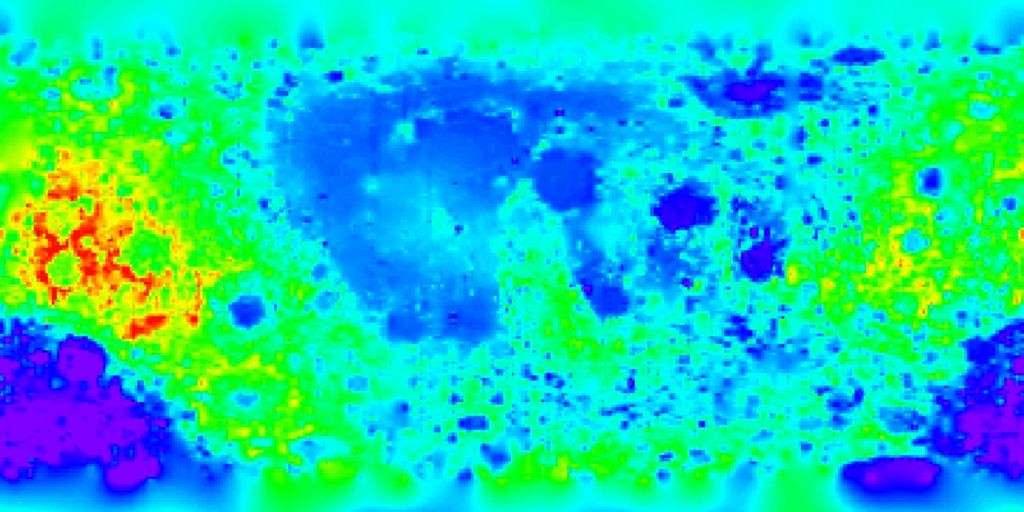
This image is identified as a cylindrical projection, but that would be inconsistent with the equal spacing (that was) on the latitude scale. Based on the way the source data is formatted, I believe that this is a variation of cylindrical projection in which the latitude lines are spaced equally. The location of the point at latitude φ and longitude θ is given by
x = θW/180°
y = (φ+90)H/180°
In this projection the left edge (the "prime meridian") appears to be the center of the side opposite the earth.
Bump-mapping requires a texture that describes how the orientation of the surface at each point differs from a smooth surface. This orientation is then used to calculate how much light is reflected at each point. For example, if there is a ridge on the surface, the side closer to a light source will be drawn in a bright shade, and the other side will be drawn in black. This shading provides visual cues that make the two-dimensional surface appear three-dimensional.
Many libraries and hardware accelerators describe the surface with a grid of normal vectors (i.e. directions perpendicular to the surface at each point). To minimize the amount of image preprocessing, I'm going to give the program an altitude map and tell it to calculate the normal vectors. In a rectangular coordinate system this task would be straightforward; if a surface is defined by F(x, y, z)=0, then its normal vector is [dF/dx dF/dy dF/dz] (where d is partial differentiation). Unfortunately the map uses a different set of coordinates.
19 July 2002
To compensate for the map's distortion, I have to determine how the height variations in the map appear on the ground. Suppose that the point at (φ, θ) is mapped onto the sphere along with neighboring points (φ+Δφ, θ) and (φ, θ+Δθ). A viewer on the surface uses a rectangular coordinate system in which z is up, y is north, and x is east. What does the normal vector look like in this system? If the surface were perfectly spherical, the normal would be [0 0 1]. If the height varies only along the line of longitude, the viewer will see a height variation of f(φ+Δφ, θ) - f(φ, θ) over a distance of approximately r Δφ, and the normal will lean north or south according to the direction of the slope. That is, the normal will be [0 -Δf/(r Δφ) 1].
What about height variations over the line of latitude? This case is more complicated, because the line of latitude does not appear straight on the surface. Any variation will cause the normal to lean along both the north/south and east/west axes. To find the effect of variations over the line of latitude I have to
- Divide the height variation by the length of the geodesic between (φ, θ) and (φ, θ+Δθ).
- Find the angle between that geodesic and the line of longitude θ
- Use the result of step 2 to divide the result of step 1 into east-west height variation and north-south height variation.
Step 1: The length of the geodesic is 2r asin(sin(Δθ/2) cos φ). For small Δθ this is approximately r Δθ cos φ. For a reality check, note that this value is also the length of the line of latitude between the two points. We should expect that for points close together on the surface the line of latitude is nearly equal to the geodesic. Dividing the height variation by this length gives the apparent surface slope along the geodesic.
Step 2: In a coordinate system that has its origin at the center of the sphere, the equation of the plane that contains the line of longitude θ is x sin θ - y cos θ=0. The equation of the plane that contains the geodesic between the two points is
x (sin (θ+Δθ) - sin θ) sin φ - y (cos (θ+Δθ) - cos θ) sin φ - z sin Δθ cos φ z=0
or more briefly,
x Δ(sin θ) sin φ - y Δ(cos θ) sin φ - z sin Δθ cos φ=0
The angle β between the two geodesics is the angle between their planes, which is the angle between their normals:
β=acos ((Δ(sin θ) sin θ sin φ+Δ(cos θ) cos θ sin φ)/sqrt(Δ(sin θ)2sin2 φ+Δ(cos θ)2sin2 φ+sin2Δθ cos2φ))
For small Δθ this becomes
β=acos(Δθ/2 sin φ)=90° - Δθ/2 sin φ
As a quick reality check, notice that when φ=0 (the equator) this reduces to β=90°. As the points approach the north pole, the angle deviates from 90°, but never by more than Δθ/2. This property can be explained by noting what happens when the points are very close the the pole. The arcs joining the points to the pole, together with the arc between the two points, form a shape very close to an isoceles triangle. The angle at the pole is Δθ, so the two base angles must be 90° - Δθ/2.
Step 3: I use simple trigonometry to divide the slope into north-south and east-west components. The deflected normal is then
[-(Δf/(r Δθ cos φ)) cos β, -(Δf/(r Δθ cos φ)) sin β, 1].
After doing all this work, I'm going to assume that height variations along the line of latitude have a negligible effect on the north-south lean of the normal vector. This is a reasonable assumption for the type of data I have, because Δθ (the longitude angle between horizontally adjacent data samples) is 360/W for all latitudes. Therefore β=90°(1-2(sin φ)/W). The moon topography image has a width of 1440 pixels, so even very close to the poles the error from 90° is less than 0.2%. The normal to the surface in the general case, then, is
[-(1/r cos φ) Δf/Δθ, -(1/r) Δf/Δφ, 1].
I might have to revisit this approximation if it causes obvious aliasing at the poles.
The last question about normals is how to map the surface normal onto the sphere. Simply adding the surface normal to the sphere's normal isn't right; I need to deflect the sphere's normal the same way that the surface normal is deflected from the vertical. If n is the surface normal, k is the vertical unit vector, and r is the normal to the sphere, then the deflected normal is r'=r+r(n/n - k).
20 July 2002
There is one aspect of bump-mapping I haven't described yet, which is how to light the surface given its normal vector. I assume that all light reflection is diffuse, and I use Lambert's law to calculate the amount of light reflected. According to Lambert's law, the light reflected to any viewer in front of the surface is proportional to the cosine of the angle between the surface normal and the direction to the light source. For each pixel on the surface of the planet, I locate its color in the color map, and then I adjust its brightness according to Lambert's law. I assume that the light source is at infinity, so that it illuminates all points from the same direction.
In equations, if r' is a normal to the planet's surface, and L is a vector toward the light source, then the brightness factor is cos <(L, r')=(L•r') / (L r').
21 July 2002
With the bump-mapping math (hopefully) out of the way, I need to know how to draw the planet sphere so I can start working on an implementation. As I scan over the picture, I need a formula to tell me what latitude and longitude correspond to a point (x, y) in the view plane. I have tried several approaches to deriving this formula, and in each case the complete formula has been horrendously complicated, so I have broken it into steps. If the sphere is centered at the origin, and the viewer is at (0, 0, d), and the view plane is z=z0, then a ray cast through point (x0, y0, z0) has the following equation:
x=x0t ; y=y0t ; z=d+(z0-d)t
This ray intersects the sphere when t is a solution to the quadratic equation
(x02 + y02 + (d - z0)2)t2 - 2d(d - z0)t + (d2 - r2)=0
This equation will sometimes have two solutions corresponding to the near and far intersections. The near intersection is the desired one, and it corresponds to the lesser solution. Once the value of t has been calculated, it can be substituted into the equation for the ray to get the coordinates of the intersection point (x1, y1, z1). The latitude and longitude of this point are φ=asin(y1/r) and θ=asin(x1/(r cos φ)). From these coordinates I can determine the point's albedo and normal vector.
How do I choose values for d and z0? They should be set so that d - z0 is the normal viewing distance, and so that the diameter of the sphere's image is less than the lesser of the viewing window's width and height (L). The edge of the image is determined by rays that are tangent to the sphere, and from this fact a simple geometrical analysis gives a radius of r(d - z0)/sqrt(d2 - r2). Setting d - z0 to 0.6m, I get
0.6r/sqrt(d2-r2)<L/2 or d>r sqrt(1+1.44/L2)
If L=2in=0.05m, then d>24.02r. To simplify the code, I can normalize the sphere's radius to 1.
9 August 2002
The project was on hold for a couple weeks while I relocated, but last night I made a lot of progress. Unfortunately it was not as much as I had hoped.

The image above shows a prototype of the viewer. It is hardcoded to display the moon in the orientation seen from earth. Three problems are apparent from this image.
- Although the bump-mapping code is present, it does not reveal any of the surface detail. A comparison of the image with and without bump-mapping shows that the only noticeable effect is a darkening toward the edge of the disk.
- There is obvious pixellation throughout the image, but most obviously along the prime meridian.
- It doesn't look much like the normal image of the moon. Compare with an image from MSN Encarta:

The Encarta image is much brighter, even at the edges, and there are more dark areas.
The good news is that the rendering is very fast. I was worried that, with so much floating-point arithmetic, I would have to wait several seconds for the image to appear.
The last problem on the list is a sure indication that the viewer is too close to the object. Since I'm trying to make the rendering as realistic as possible, I have set the view-plane distance to a typical value, and then set the object distance as needed to make the image fill the rendering area (about 2 inches high on my screen). Unfortunately this means that the viewer's altitude is only 1/6 of the planet's radius, and only 30° of the surface is visible in each direction. A viewer on earth can see 89.7° of the moon in each direction. I want my rendering to show at least 80°, but I want it to fill the entire viewing area. I can't meet both constraints with a "real" moon.
10 August 2002
As promised yesterday, I modified the rendering algorithm so that it displays a large surface area, rather than producing an exact scale image. Suppose that I want to project the planet onto a square viewing area L units on each side, and I want to set the viewing distance, planet radius, and planet distance to meet two constraints:
- From the center of the image to the edge must be 80° of surface arc.
- The image must fill the entire viewing area.
The edge of the image is where the line of sight is tangent to the planet's sphere. All such lines of sight must therefore intersect the sphere at right angles to the radius at the point of intersection. The first constraint says that all such radii must make an 80° angle with the line between the planet's center and the viewer, so this problem is all about right triangles that have 80° angles. The distance between the viewer and the viewing plane (previously called (d - z0)) must be (L/2) tan 80° in order for the image to touch the edge of the viewing area. The planet radius can be whatever I want, since a small sphere up close is indistinguishable from a large sphere far away. However, I want to make sure that the planet is behind the viewing plane, so I make the planet distance 1 greater than the viewing distance. Then the radius must be d cos 80°.
When I make these changes to the rendering, I get an image that compares much more favorably with photographs. The animation below alternates between two renderings, one bump-mapped and the other "flat."

I'm not sure at this point why the image doesn't go all the way to the edges. I have hard-coded some of the math described above, so round-off error is a possibility. The discrepancy looks too big for that, though. The effects of the bump mapping are most noticeable on the left side of the image, where the bump-mapped picture has dark spots that aren't in the flat image. I have made two modifications to make the bump-mapping slightly more apparent. First, I increased the brightness of the color map. Second, I move the light direction to 30° from the viewer-planet line, since straight-on light doesn't produce any shadows or highlights where the features appear largest (the middle).
Unfortunately, the bump map doesn't show the features of the surface. I hope that the other planets (especially Mars) will give more impressive results. To make the bump map brutally obvious, I scaled the topography data by a factor of 10 (i. e. every feature becomes 10 times as tall or deep).

You see it now, don't you? The lighting on well-known craters such as Tycho (about 2/3 of the way from the center to the bottom) and Copernicus (about halfway between the center and upper left) is now apparent. If your display has at least 16-bit color, you might be able to make out the edges of an enormous basin just inside the upper left edge and a smaller one inside the lower left edge. All of this detail is produced simply by painting colors on a sphere! I wrote the rendering code in a couple of days and used stock JPL maps. Imagine how much more difficult it would be to build and render a complete polygonal model of the moon.
19 August 2002
The rigors of the job search and the difficulty of getting planetary data have distracted me from this project. While looking for asteroid NY40 on the weekend, I did some more lunar observation. I noticed that the shadow line on the moon is much sharper than it is in my rendering. To incorporate this fact into the program, I tweaked the illumination law to the following form inspired by some web research:
I=(L•n / (L n))m
where I is illumination, L is the vector toward the light source, n is the surface normal, and m is an adjustment constant. For small values of m, the illumination falls off very slowly until the surface is almost parallel to the light, at which point it falls very rapidly toward zero. I found that m=1/3 gives realistic results. This change also had an unexpected side effect; it made the bump mapping show up! Take a look at the following half-moon image:

Is it real or rendered? This image was made without exaggerating the height data, but even small craters are visible just inside the lighted area.
30 January 2003
I'm working on this project again, to prepare it for a demonstration at a local astronomy club meeting. That means I have to make it look and work like a real Windows application rather than a toy. I've moved the planet selection list into a menu, added the capability to resize the window, and simplified the planet rendering class. A friend has shown me where to find some very nice earth data, which I will probably include.
2 February 2003
This weekend I got the planet view to rotate for the first time, as shown below. Note that I have gone back to Lambert's law for now, and have disabled bump-mapping by setting the range of height data to zero. This is only because I have lost the correct height range. The first image is the familiar front side of the moon, and the second is the far side.


17 February 2003
I have uploaded the source code for employers to look at. The main things holding me back right now are lack of good planetary data for anything except the moon (which isn't quite what I want either).
Earth:

20 February 2003
Some research turned up (part of) the answer to why my illumination model doesn't give realistic results. The correct model for the moon is not Lambertian diffuse reflection, but a bidirectional reflection distribution function. In a BRDF, the intensity of reflected light is dependent on the positions of both the observer and the source. A BRDF model appropriate to the moon was described by James Blinn, who also was the first to describe bump mapping.
The other part of the answer is that I need to reduce the range of the color map; it's quite exaggerated from the actual appearance of the moon.
3 March 2003
I've decided to call it quits on this project. I was successful at displaying a bump-mapped surface, which was my original concept. I also learned to use several key parts of MFC and GDI. Unfortunately I am held back by the lack of a convincing illumination model (which I cannot find, even at the local college library) and the lack of processed planetary data. Neither of these problems have anything to do with learning Windows development, which should be the priority. I was looking forward to demonstrating the program at the astronomy club, but I really have to move on.
I had intended to display information about each planet in the lower part of the window, but that does not work satisfactorily. I cannot find a way to display a document that is stored in the program's resource list, nor to display it as a file without using the complete path on my disk.
6 March 2003
I thought I'd provide an overview of the trouble I ran into when trying to present a planet description in the web browser window. My first approach, and the obvious one, was to place files containing the descriptions in the program directory and use relative URLs to load them. The problem was that relative URLs didn't work. Unless I gave the complete path, the browser displayed an error.
Next, I remembered that it was possible to use the Document Object Model to insert new elements into a web page. Maybe I could grab the blank document and insert the entire planet description into it. I tried to do this by calling the web browser's get_Document method, and got a useless null pointer.
My third attempt was based on the recollection that the MSDN browser used some kind of special URL class for its documents. I tracked down the API for adding new URL classes, but it requires changes to the registry. I didn't think that was appropriate for a small demo like this one.
So finally I decided to grab the command line, extract the application directory from it, and use that to build a document URL. This approach actually worked. I'm not sure if it's a good design, though.
