Density of “Scots” R1b subclade
throughout Britain
One way to examine the distribution of the Scots R1b
subclade is to infer it via surname distribution. To briefly recap, most surnames became
fixed, and inherited from the father, sometime between 1000 and 1200 AD in
Britain and Ireland. In many cases the origin of the surname was restricted to
an individual or perhaps a group of people from a small location. There are
variations and exceptions, such as non-paternity events, but surnames can act
as a useful proxy of male lineage. Plotting the distribution density of a
surname typically still shows a strong localisation around the original source
region. Thus if an individual is from a particular Y chromosome haplogroup,
plotting the distribution of the surname of that individual, plots the
distribution of one strand of that haplogroup at the time the census was
taken. Cumulating these up over all
surnames found within a subclade can provide an indication of distribution of
the subclade across the entire country.
However, account needs to taken of potential biases.
1.
Surname studies have shown
several distinct haplotypes may co-exist within a particular surname, so it is
important to adjust for this.
2.
In addition, some regions, for
example, large cities have had strong immigration and mixing of haplotypes and
surnames. Plotting raw numbers of surnames by region accentuates this effect,
plotting proportional distributions removes or reduces this effect, as does
removing data from these large urban areas. Another way to reduce, if not
remove this effect, is to use the oldest comprehensive census material
available. This reduces the effects of the massive urban drift of individuals
over the past 200 years with the advent of the industrial revolution.
3.
Y haplotype databases are also
typically biased with different proportions of individuals contributing from
different surnames. This is normally only a problem where it is coupled with a
geographic bias as well.
4.
If there is such a geographic
bias, one way is to adjust and compare all values against a larger reference
haplogroup surname distribution, of which the subclade being examined is a
component. In this case the entire R1b haplogroup can act as such a group.
5.
The haplogroup distribution can
also be assumed to be similarly biased, so expressing results as a proportion
of the larger group will reduce or remove the geographic sampling bias.
6.
A more comprehensive approach is
to estimate the sampling distribution of the entire database against the
population distribution, in the various counties and then adjust values on that
basis. This latter approach has the additional advantage that true estimates of
the frequencies of the various Y chromosome subclades can also be
estimated.
In summary, each individual with a given Y
chromosome haplotype subclade and surname is an independent replicate of a
sample of the distribution of the haplotype subclade 1000 years ago. Subsequent
population movement has “blurred” this distribution, but normally
surnames still reflect their original source (for those interested see results
from the phase 1 study). If appropriate corrections
are taken to remove or reduce biases then using surnames as a proxy for
haplotype will provide good estimates of regional distribution of the haplotype
at an earlier time with small sample numbers.
Those interested in further reading about the
various uses of surname distribution analysis for genealogical research such
visit http://homepages.newnet.co.uk/dance/webpjd/index.htm
Methodolgy
For the
37 STR cluster analysis described, (Phase
II analysis) the core “Scots” R1b haplotype subclade was
represented by 34 individuals (22 unique surnames) out of a total of 713 R1a
and R1b haplotypes sampled (485 unique surnames).
Bias adjustment:
1.
No preselection on name was
undertaken when extracting from Ysearch, the selection criteria was solely on
haplogroup and geographical location, so it is expected that there is some
geographical bias within Britain of the surnames in this dataset outside of
that already expected by the selection on haplogroup alone (completed see graph below).
2.
Biases in incidence in surname
frequency within the cluster relative to the total group were adjusted to
provide a proportional weighting for that sub-component of the surname. For
example the McDonald surname occurred 2 times within the subcluster and was
present 6 times in total, providing a weighting factor of 2/6. This correction
was made in all cases (completed
see graph below).
3.
Geographical biases were
corrected in either of two ways:
a)
Two random samples of 100 surnames
from all British samples were plotted to estimate geographic bias and surname
sampling coverage for each county and appropriate weighting factors. For
example if a county had an estimate of 5 percent of individuals had surnames
sampled in the database the weighting factor would be the reciprocal i.e. 20 (still to be done).
b)
Two random samples of 100
surnames from all R1a and R1b 37 STR sample were plotted to estimate there
coverage of each county and allow proportional corrections i.e. expressed as a
percentage of R1a and R1b. For example if the number in the county was 25,000,
R1a and R1b estimate was 5,000 and subclade estimate was 1,000 a value of
20,000 per 100,000 would be used (i.e. 1000/5000*100000) (still to be done)
4.
Each surname within the cluster
then had the incidence of the surname in each of the counties extracted from
the 1881 census data stored in the Surname Atlas (http://www.archersoftware.co.uk/index.htm
) and these incidences were scaled by the appropriate weighting factors
relevant to the analysis in question (2, 2+3a, 2+3b). The sum of the scaled values for all
surnames, within each county, were then plotted using GenMapUK expressed as a number per 100,000 individuals for the 1881 census.
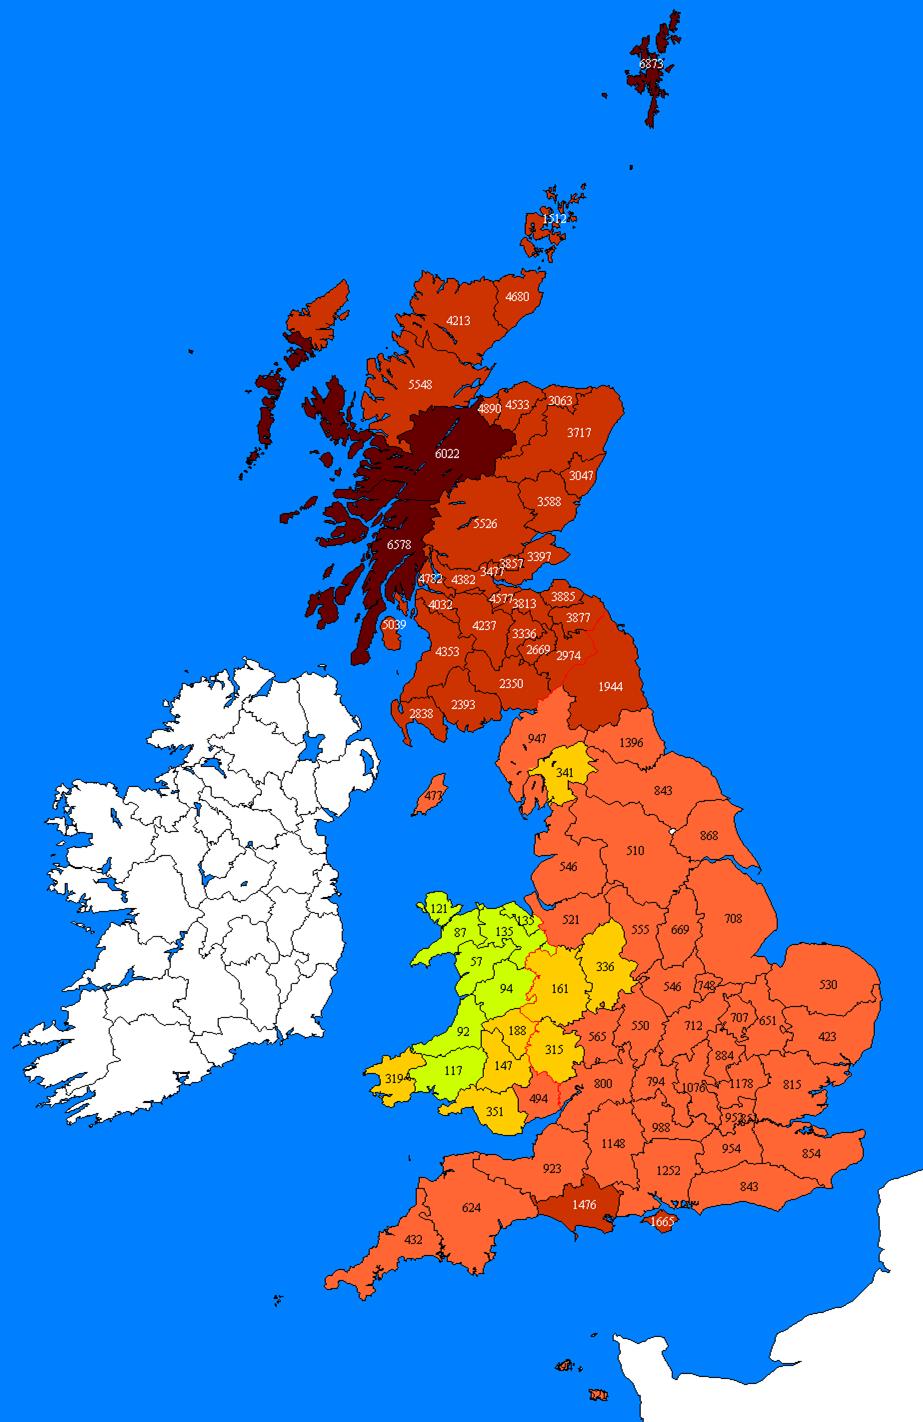
Figure 1.
Plot of the estimated frequency per 100,000 people of the R1b
“Scots” core subclade throughout Britain inferred from weighted
surname density, uncorrected for total incidence and DNA database sampling
biases.
Results
The results, uncorrected for
total incidence and DNA sampling biases, suggest the highest density occurs in
counties north and west of Glasgow. High incidences also occur in the
Shetlands, perhaps as a result of the DNA sampling in that region. Closer
examination identifies that levels are consistently high in Scotland, including
the majority of the lowlands. Below the Scottish border the level drops to
approximately one sixth of the incidence. A further 3-5 fold drop occurs in
Wales where the frequency is only 1 thirtieth of that in Scotland. In broad
terms the divisions define the boundaries of present day England, Scotland and
Wales. The observed boundaries also reflect historical divisions since Roman
times. Therefore it is perhaps not surprising that the sub-clade follows a
similar pattern. However, before any conclusions can be reached potential sampling
biases also need investigated and data adjusted appropriately.
This work is incomplete and has been posted for
discussion on the DNA genealogy listserver only. Corrected and adjusted results
need to be plotted and described.