Department of Defense Medical Treatment Facilities (MTF) assess the level of patient satisfaction at Army, Navy and Air Force facilities across the nation through the analysis of monthly consumer satisfaction surveys. A statistical analysis of data for all regions was performed for the period January 1997 to October 1999. Data from 22,495 completed surveys were included in the analysis. The purpose of the analysis is to determine which factors most influence the patient's perception of quality of service. Univariate Analysis of Variance (ANOVA) and Regression produced the following results.
| Cases | ||||||
|---|---|---|---|---|---|---|
| Valid | Missing | Total | ||||
| N | Percent | N | Percent | N | Percent | |
| Q3J OVERALL QUALITY OF CARE & SERVICE RECEIVED * MSERVICE | 21495 | 95.4% | 1043 | 4.6% | 22538 | 100.0% |
| Q3J OVERALL QUALITY OF CARE & SERVICE RECEIVED * MBENEGRP | 21495 | 95.4% | 1043 | 4.6% | 22538 | 100.0% |
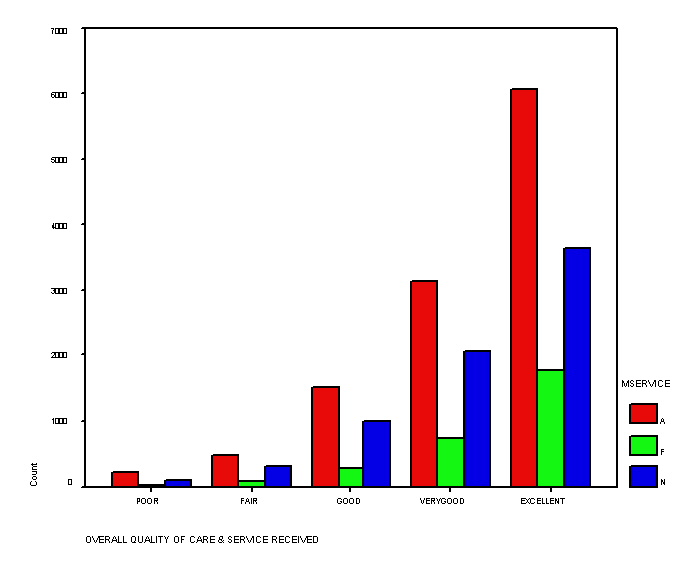
| MSERVICE | Total | ||||
|---|---|---|---|---|---|
| 1 A | 2 F | 3 N | |||
| Q3J OVERALL QUALITY OF CARE & SERVICE RECEIVED | 5 EXCELLENT | 6068 | 1779 | 3645 | 11492 |
| 4 VERY GOOD | 3149 | 754 | 2062 | 5965 | |
| 3 GOOD | 1530 | 282 | 973 | 2785 | |
| 2 FAIR | 491 | 88 | 300 | 879 | |
| 1 POOR | 221 | 30 | 123 | 374 | |
| Total | 11459 | 2933 | 7103 | 21495 | |
| MBENEGRP | Total | |||||||
|---|---|---|---|---|---|---|---|---|
| 1 ACT | 2 DA | 3 RET | 4 DR:DS | 5 GRD | 6 OTH | |||
| Q3J OVERALL QUALITY OF CARE & SERVICE RECEIVED | 5 EXCELLENT | 1889 | 2805 | 3364 | 3242 | 75 | 117 | 11492 |
| 4 VERY GOOD | 1289 | 1834 | 1203 | 1516 | 72 | 51 | 5965 | |
| 3 GOOD | 690 | 1097 | 316 | 619 | 34 | 29 | 2785 | |
| 2 FAIR | 215 | 392 | 100 | 155 | 11 | 6 | 879 | |
| 1 POOR | 83 | 166 | 43 | 72 | 3 | 7 | 374 | |
| Total | 4166 | 6294 | 5026 | 5604 | 195 | 210 | 21495 | |
Key: Active Duty (AD), Dependent of Active Duty (DA), Retiree (RET), Dependent of Retiree or Deceased (DR:DS), Guard and Reserve (GRD), Other (OTH)

| Source | Type III Sum of Squares | df | Mean Square | F | Sig. |
|---|---|---|---|---|---|
| Corrected Model | 1300.586(a) | 107 | 12.155 | 14.222 | .000 |
| Intercept | 10246.629 | 1 | 10246.629 | 11989.011 | .000 |
| MSERVICE | 13.119 | 2 | 6.560 | 7.675 | .000 |
| AGE | 29.629 | 7 | 4.233 | 4.952 | .000 |
| MBENEGRP | 10.251 | 5 | 2.050 | 2.399 | .035 |
| MSERVICE * AGE | 10.888 | 14 | .778 | .910 | .547 |
| MSERVICE * MBENEGRP | 22.674 | 10 | 2.267 | 2.653 | .003 |
| AGE * MBENEGRP | 29.094 | 26 | 1.119 | 1.309 | .134 |
| MSERVICE * AGE * MBENEGRP | 38.007 | 43 | .884 | 1.034 | .410 |
| Error | 18278.794 | 21387 | .855 | ||
| Total | 411695.000 | 21495 | |||
| Corrected Total | 19579.380 | 21494 | |||
| a R Squared = .066 (Adjusted R Squared = .062) | |||||
| R | R Square | Adjusted R Square | Std. Error of the Estimate | Change Statistics | |||||
|---|---|---|---|---|---|---|---|---|---|
| Model | R Square Change | F Change | df1 | df2 | |||||
| 1 | .171(a) | .029 | .029 | .94 | .029 | 325.103 | 2 | 21492 | .000 |
| a Predictors: (Constant), AGE, MSERVICE | |||||||||
| Model | Sum of Squares | df | Mean Square | F | Sig. | |
|---|---|---|---|---|---|---|
| 1 | Regression | 574.949 | 2 | 287.474 | 325.103 | .000(a) |
| Residual | 19004.432 | 21492 | .884 | |||
| Total | 19579.380 | 21494 | ||||
| a Predictors: (Constant), AGE, MSERVICE | ||||||
| b Dependent Variable: Q3J OVERALL QUALITY OF CARE & SERVICE RECEIVED | ||||||
| Unstandardized Coefficients | Standardized Coefficients | t | Sig. | |||
|---|---|---|---|---|---|---|
| Model | B | Std. Error | Beta | |||
| 1 | (Constant) | 3.788 | .024 | 159.546 | .000 | |
| MSERVICE | 2.033E-02 | .007 | .019 | 2.856 | .004 | |
| AGE | 7.796E-02 | .003 | .173 | 25.499 | .000 | |
| a Dependent Variable: Q3J OVERALL QUALITY OF CARE & SERVICE RECEIVED | ||||||
