Precision Farming (PF), including Global Positioning Systems (GPS), Geographical Information Systems (GIS), yield monitors and variable rate controllers, allows the producer to vary inputs across the field according to a pre-determined geo-referenced prescription as well as determine the crop yield variability across his field or verify easily and accurately the impact of specific production technologies. The goal with PF is to allow more efficient use of inputs, whether they are fertilizers, pesticides, management or labor, across the landscape. The end result is to maximize financial advantage and minimize production risks while at the same time ensuring environmentally sound production practices.
One of the most useful tool in visualization of spatial distribution of crop yield across the fields is a yield map produced on the go with a GPS system connected to a yield monitor placed in the combine during Harvest. Yield maps, imported and manipulated inside a GIS system, will display, in a 2-D format, the spatial variability of crop yield across the field. As Previous research (Moulin et al 1994) showed that crop yield and soil erosion were related to a multivariate factor composed of relative elevation and surface curvature and that variability of crop yield in the landscape was attributed to the effect of relative elevation and surface curvature on overland flow of water and related soil properties, it is somewhat difficult to visualise these effects in a 2D format. Using ArcView GIS software with the 3D analyst extensions, one can visualise and query the effects of elevation on Crop yield variability.
The Precision Farm consists of 310 acres located 2.5 miles east of the town of Indian Head in Saskatchewan, Canada. The Half section of land was divided in 8 - 40 acre fields and a crop rotation of Wheat, Canola and Peas has been followed since 1998.
In 1998, 310 steel rod were inserted in the ground at an acre spacing and Georeferenced with a GPS system to permanently mark the sampling sites used for future data collection.
Since 1998, Remote sensing images from different satellites, yield maps, elevation measurements as well as soil fertility, plants, weeds and disease counts collected at each sample pins has been collected in order to evaluate the effectiveness of different Precision Farming practices for Western Canada.
Materials and Methods:
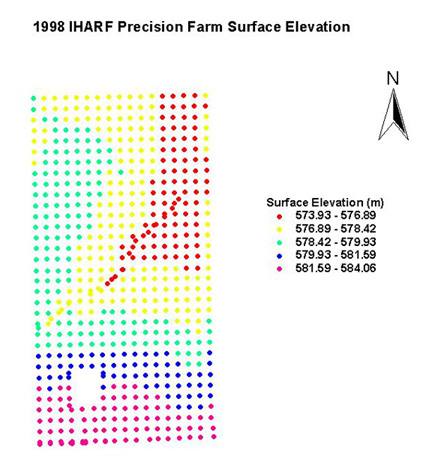
In August 18th, 1998 the PFRA did an elevation survey on the Precision farm using a Total Station referenced to a geodetic survey point from Natural Resources Canada. All elevation points were then projected in UTM NAD 83, zone 13 ( Figure 1 ).
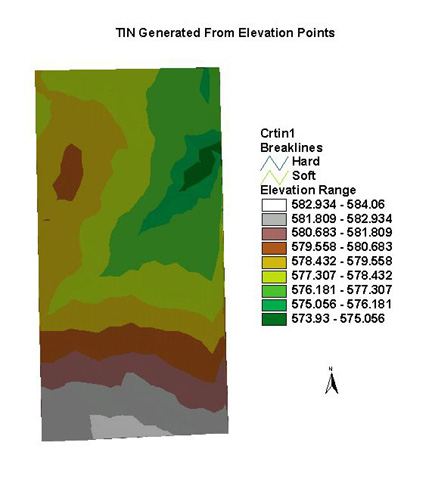
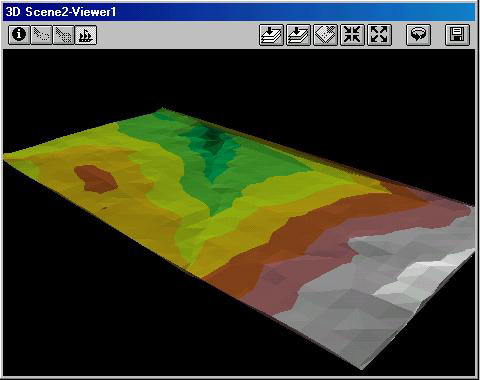
and overlayed onto a 2000 Ikonos panchromatic high resolution image ( Figure 2 ).A 2D Triangulated Inverse Network (TIN) map ( Figure 3 ) was then created using ArcView 3D analyst extension to create a continuous elevation surface of the study area. The 2D Georeferenced TIN was then transformed to a 3D TIN ( Figure 4 ) using the same ArcView extension, for a better visual evaluation of the topography. ( Click Cosmo to download Cosmo 2.0 3D browser to look at the TIN of the Precision Farm in a 3D view. Then click TIN to download the 3D TIN. With the browser you will be able to zoom in/out, pan, rotate and much more ).
In May 7th, 2000 a high resolution Ikonos panchromatic image was acquired for the area of Indian Head, SK ( Figure 5 ). The area covered by the image was 10 km x 10 km. The Image had to be cropped around the study area using ArcView CropMiser extension, and Georeferenced to known UTM reference points using ArcView ImageWarp 2.0 extension ( Figure 6 ).
Fields 1,3,6 and 8 of the Precision Farm were seeded to wheat on May 3rd, 2000 and harvested on September 14th and 15th, 2000. A New Holland TR 99 Combine ( Figure 7 ) equipped with a Mid-Tech GPS receiver with the Omnistar DGPS and an AgLeader 3000 yield monitor were used to harvest the fields. The yield maps created were projected in UTM NAD 83 Zone 13 coordinate system using ArcView Projector extension.
Once projected, the yield maps were imported into GS + software to be kriged using an exponential semivariogram and exported as a .txt point file.
The .txt files were then plotted into ArcView ( Figure 8 ) and a yield surface was interpolated using a spline surface interpolation from ArcView Spatial Analyst extension. The interpolated yield surfaces were converted to a grid map and overlayed onto the Ikonos imagery ( Figure 9 ) .
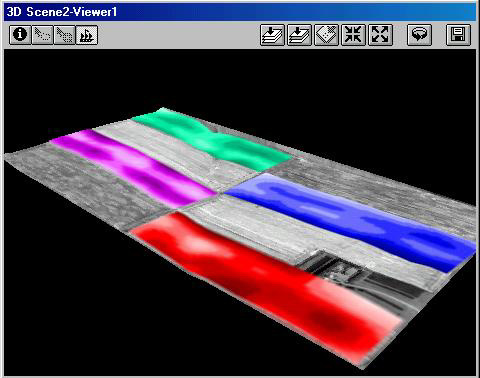
Using ArcView 3D Analyst extension, the Ikonos image was "rubbersheeted" on top of the TIN and the grid maps of the wheat yield were superimposed on top of the 3-D Ikonos image to create a 3D visual effect of the topography and crop yields (Figure 10).
Results and Discussion:
The preliminary results of the 3D scene was a good visual indicator of the reality.
The transformation of a 2D Ikonos image to a 3D image highlighted the micro-topography of the farm.
Small depressions in the relief were well highlighted from the Ikonos image such as the draw running South West to North East of the farm.
We can also visually notice the effects of the low topography on the spatial distribution of wheat yield especially in field 1 and 8, where yields of wheat standing in the draw are much lower than yields located on a higher , better drained surface.
Although no spatial analysis of the effects of topography on wheat yields were done, we can intuitively notice the interaction between the two, where lower elevation areas where water is most likely accumulating after a rain , had a more negative impact on the wheat yields than the higher elevated, gentle sloping, better drained areas of the field .
Conclusion:
The transformation of a high resolution Ikonos panchromatic image into an ArcView 3D scene highlighted topographical features that were not noticeable in a 2 dimensional format.
Although no analysis on the effects of topography on wheat yield or any other agronomic studies were done to determine the cause of the yield variability in each field, the overlay of yield maps onto the 3D Ikonos image highlighted the higher and lower productive areas of the each field that visually seemed correlated to the topography.
More research needs to be conducted to determine the exact contribution of topography to the spatial distribution of wheat yields.
References:
Moulin, A.P., Anderson, D.W. and Mellinger, M. 1994. Spatial variability of wheat yield, soil properties and erosion in hummocky terrain. Can. J. Soil Sci. 74:219-228