This project will attempt to clearly describe the bases of the bioslurping technology, as well as, investigate and understand the fluid mechanics of horizontal radial flow in porous medium as applied to soil decontamination by bioslurping.
The design of a bioslurping lab model is necessary to investigate the radial flow near the extraction pipe. The investigation is based on the theoretical analysis and experiments. Results can be used for field scale designs. Once the equations or flow near the extraction pipe are verified, the lab model results can be extrapolated to larger radii to determine a practical radius of influence. With lab model recovery rates and radius of influence known, as a function of test parameters, one can select an ideal pump size and determine well spacing in the field.
One of the biggest concerns in regards to our environment is leakage of underground storage tanks. While most often associated with gasoline service stations, these tanks are also used by industry, transportation, power generation, agriculture, government agencies as storage facilities for gasoline, diesel, jet fuels, oil, hazardous chemicals, and chemical waste products. The Office of Technology Assessment (OTA, 1984) estimates the number of tanks, both abandoned and in use, at 2.5 million. An EPA study found that 47 states suffered ground water contamination from faulty underground tanks.
Many tanks installed in the 1950s and 1960s are still in use today or have been abandoned or forgotten. Underground tanks can leak due to internal or external corrosion of the metal. Leaks can occur through holes in the tank or in associated piping. In a recent survey of motor fuel tanks, the EPA1 found that 35% of the estimated 800,000 such tanks leaked. The remediation of contaminant plumes has become a major focus of hydrogeologic assessments in the United States due to the potential threat to humans and environment. The contaminant will disperse into the soil voids in the vadose zone, and eventually the hydrocarbon contamination may reach the groundwater level. This is a serious problem because of groundwater’s great importance as one of the major sources of drinking water in America; especially in California, where 50 % of drinking water is supplied by groundwater. Liquids having a specific gravity of less than 1.0 and low solubility and miscibility in water are called Light Non-Aqueous-Phase Liquids (LNAPL). These immiscible fluids exhibit different behavior and properties in the subsurface than dissolved contaminant plumes. While components of dissolved plumes are invisible to the naked eye and travel with the flow of groundwater, LNAPLs in the subsurfaces form a visible, separate oily phase whose migration is governed by gravity, buoyancy, and capillary forces.
LNAPLs are primarily associated with production, refining, distribution, and storage of petroleum products. Spills and accidental releases of gasoline, kerosene, diesel, and associated condensates are common sources of LNAPLs to groundwater. When LNAPL is released at the surface, it first migrates downward through the unsaturated zone under the force of gravity. Upon encountering a water-bearing unit, the LNAPL forms a pancakelike layer in the top portion of the saturated zone. Groundwater flowing past the floating LNAPL dissolves soluble components of the LNAPL, forming a dissolved plume downgradient of the LNAPL zone. Typical chemicals of interest resulting from dissolution of petroleum products include benzene, toluene, ethyl benzene, and xylene (BTEX), as well as other aromatic hydrocarbons.
Because LNAPLs do not penetrate very deeply into the water table and are relatively biodegradable under natural conditions, they are generally thought to be more manageable environmental problem than dense nonaqueous phase liquids (DNAPL) releases. With small scale releases (such as those found at many service stations), natural processes will usually attenuate the environmental impacts within a span of several years.
At many contaminated sites, petroleum contamination is present both in the vadose zone and in the capillary fringe as free product. Regulatory guidelines generally require that free-product recovery take precedence over other remediation technologies, and conventional wisdom has been to complete free-product removal activities prior to initiating vadose zone remediation. "Bioslurping" is a dynamic new technology that teams vacuum enhanced extraction (liquid and vapor), and bioventing to simultaneously recover free-product and remediate the vadose zone soils.
Unlike other free-product recovery (FPR) technologies, a bioslurping system treats two separate geologic media simultaneously. The bioslurper system withdraws free product, and LNAPL vapors trapped in the soil (soil vapor) in the same process stream. If the LNAPL is in contact with groundwater, both liquids may be withdrawn together. Groundwater is separated from the free product, treated (when required) and discharged. The free product that is recovered can be recycled. Flow of air provides oxygen to microorganisms, in an aerobic reaction which metabolizes hydrocarbons to produce harmless water and Carbon Dioxide. LNAPL vapor is treated (when required) and discharged. Bioslurper systems are designed to minimize environmental discharges of groundwater and soil vapor. In some instances volatile discharges can be kept below treatment action levels.
Bioslurping improves free-product recovery efficiency without requiring the extraction of large quantities of groundwater. The slurper system pulls a vacuum of 5 to 20 inches of mercury in the recovery well to create a pressure gradient to force movement of fuel into the well. The systems are designed and operated to cause very little drawdown in the aquifer, thus reducing the problem of excessive groundwater extraction.
Bioventing of the vadose zone soil is achieved by withdrawing soil vapor from the recovery well. The slurping action of the bioslurper system cycles between recovering liquid (free product and/or groundwater) and soil vapor. The rate of soil vapor extraction is dependent on the recovery rate of liquid into the well. When free-product removal activities are complete, the bioslurper system is easily converted to a conventional bioventing system to complete remediation of the vadose zone. 2
Several factors combine to make bioslurping a cost-effective approach for remediation at sites having free product:
Historically, the fluid mechanics of porous media have been developed to solve problems in groundwater and petroleum engineering. Oil, gas and water are often trapped in porous underground reservoirs. Since the density of gas is less than that of oil, which is usually less than that of water, these three fluids will generally stratify themselves within reservoir.
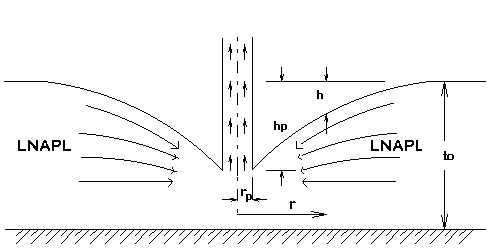
Analytical equations have been developed describing the flow behavior of the different phases present in the Bioslurping system. The study is done in free space and porous medium. To describe the flow behavior at the extraction pipe, a thin layer of low specific gravity LNAPL (about 0.9) is assumed to be floating on a body of water inside the lab model and to be insoluble and immiscible in the water. The LNAPL is to be extracted using a vacuum pump. Ideally, the LNAPL can be pumped from an extraction depth (H=32/0.9 = 36ft). The extraction depth of an LNAPL-air mixture would increase further because specific gravity of an LNAPL-air mixture is less than 0.9. The suction of an oil-air mixture is called "slurping." When the LNAPL is extracted, radial flow is produced as the LNAPL flows toward the extraction pipe. Near the opening of the extraction pipe (in free space) the radial velocity increases, causing a depression of the surface. The action taking place, is a transformation of potential head to velocity head and viscous drag. As the level of the LNAPL above the water decreases, the level of the LNAPL/ water interface will rise due to a pressure decrease of the interface. The rate of extraction (Q) will depend on interaction of parameters which are listed in the following table:
| Categories | Field Parameters | Comments |
|---|---|---|
| Properties of contaminant | Density, viscosity, vapor pressure, solubility, surface tension | None |
| Substrate and SoilConditions | Permeability, moisture content, porosity, capillary pressure, LNAPL layer thickness | Capillary pressure and permeability greatly affect the pressure head |
| Design and Operational Parameters | Extraction tube diameter, well spacing, applied vacuum, flow rate, depth of extraction pipe, cone of depression | Depth of well is usually limited to 40 ft |
It is assumed that there are no viscous forces. Vertical components of velocity are neglected. Potential head is converted to velocity head. Free LNAPL lies above a impervious surface.

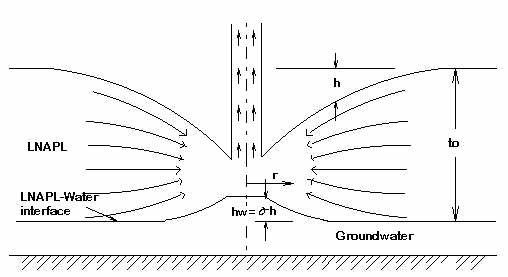
II. LNAPL and Water in Free Space
This flow regime is similar to Phase I except that the LNAPL lies above a body of water instead of the horizontal impervious surface. As the level of the LNAPL surface drops approaching the extraction tube the pressure on the surface of the water is reduced and the level of LNAPL-Water interface rises by an amount hw = sh.

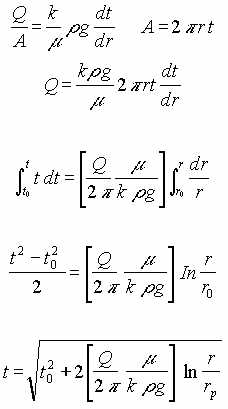
III. LNAPL in Porous Medium, Gravity Driven
This flow regime is typical of liquid flow into an open well.

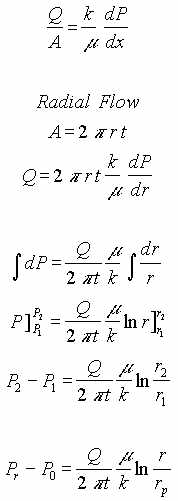
IV. LNAPL in Porous Medium, Pressure Driven.
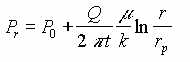
This flow regime consist of a porous medium of constant thickness, t. A vacuum at the center causes radial flow of LNAPL in the medium.

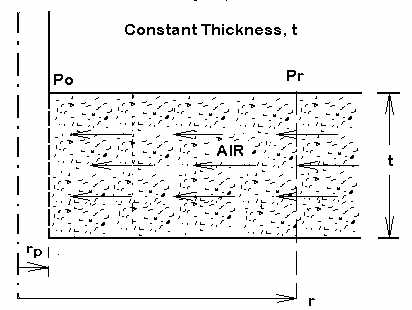
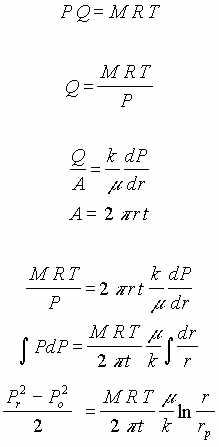
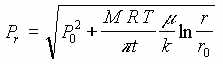
This flow regime consist of porous medium of constant thickness, t. A vacuum at the center causes radial flow of air in the medium. Since the air is compressible the volume flow rate, Q, increases as pressure drops but the mass flow rate, M, remains constant.
| Proposed Test Phase | Media | Analytical Equationsdeveloped to describe flow behavior and calculate flow rate |
|---|---|---|
| I | LNAPL in free space | 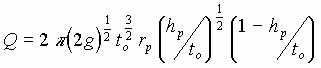 |
| II | LNAPL and water in free space | 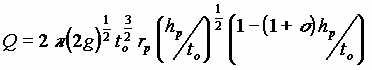 |
| III | LNAPL in porous medium, gravity driven | 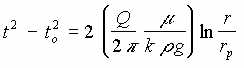 |
| IV | LNAPL in porous medium, pressure driven | 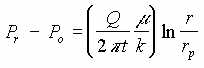 |
| V | Air in porous medium, pressure driven | 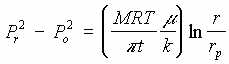 |
| VI | Air and LNAPL in porous medium, pressure driven | Q = To be determined |
| Q = Extraction rate of LNAPL | g = Gravitational acceleration |
| to = Thickness of the LNAPL at an infinite distance | t = Thickness of LNAPL as a function of radius |
| r = Radius from center of extraction pipe | rp = Radius of the extraction pipe |
| h = Depression of LNAPL surface below original surface | hp = Depression of LNAPL surface below original surface at extraction pipe |
| r = Specific density | s = Specific gravity of contaminant |
| m = Dynamic viscosity | k = Darcy’s constant |
| M = Mass flow | R = Gas constant |
| T = Absolute temperature | tA = Thickness of air |
| P = pressure | Po = Pressure at radius of extraction pipe |
| Pr = Pressure at radius r |
A three dimensional model was selected over a two dimensional are because a constant cross sectional area of a 2-D model, does not incorporate the change of flow area with radius observed in the field. Since changes in velocity directly affect the recovery rate, and analytical 2-D model used to study the flow behavior (A1V1 = A2V2 due to conservation of mass and continuity) near the extraction pipe, is not realistic. The effects of chemical attack such as corrosion have been considered in selecting materials. The model is used to verify the analytical equations determined in the previous section.
The lab model is a 40" x 40" x 40" test chamber, one quadrant of full scale model of a typical bioslurping well installation with the extraction pipe at one corner. It can be filled with porous medium (glassbeads) to any desired depth. It was designed such that it can easily be modified to carry out parametric studies of horizontal radial flow. Effect of vacuum on flow depth can be observed through side walls and measured directly. Pressure gauges and flow meters are used to record test parameters. The extraction pipe (1" outside diameter) is secured to one of the corners of the test chamber and can be adjusted vertically to study the effects of various depths of extraction into the contaminant. A vacuum pump draws the contaminant into a measuring tank where the volume of contaminant extracted can be measured by the changing level in the tank. Contaminant can be returned (using a liquid pump) to a storage tank that supplies the test chamber with continuous flow of contaminant by means of a centrifugal pump if needed. Page 17 shows the bioslurping lab setup.
By changing the depth of the extraction tube, the level of vacuum and the type of liquid, the flow behavior near the extraction tube can be investigated. In addition to the direct measurement of the liquid behavior, the measurement of pressure drop is observed using the pressure gauges.
The top of the porous medium is covered by a plexiglass plate. Two of the edges of the plate are sealed to the walls to avoid air infiltration along the edges. Also, in order to measure the pressure drop radially toward the well, four pressure gauges are installed on the top of the plate at a known distance radially from the extraction pipe.
Instead of LNAPL, water was used for liquid flow test to avoid fire hazard with volatile, combustible liquid.

Some of the problems that were faced are the following:
1. Presence of water in the output of the vacuum pump. The output of the vacuum pump is connected to a flow meter. Water from the vacuum tank got into the flow meter therefore it did not display correct readings. To correct this problem, a water separator was installed before the flow meter.
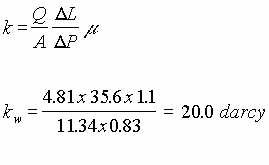
2. A test column was constructed in order to determine the permeability of the glass beads that would be used in the experiments. The flow rates of air and water through the glass beads were determined by the experiments. The theoretical values were compared with the ones obtained in the test column experiment to prove the theory. The experiment with water was performed, air leaks were discovered on both ends of the test column at the cap seals. Since these leaks were discovered, the previous experiment run for air was invalid. It was hard to notice air leaks , but with liquid, air bubbles were visible. One approach in fixing the leaks was to remove the cardboard gaskets attached to both ends of the test column replacing them with rubber bands. In addition the top and bottom caps were taped with electrical tape. There were still air leaks after this modification. Silicone was then applied to both sides of the rubber bands gaskets. Then the caps that seal the test column on both ends were sealed using duct tape. There is still some questions of the accuracy of permeability measurements (ka = 20 for air, kw=39 for water).
3. The inner and outer screens that serve to hold the glass beads in place in the tank had to be modified. A copper screen was placed on the inner and outer aluminum screens to prevent the glass beads from passing through the aluminum screens during the test.
4. Leaks were found in the inner screen of the test chamber. To attempt to solve this problem, the sides and bottom of the inner screen were sealed. A test was then run, but leakage of glass beads in the inner screen appeared. The glass beads had to be taken out of the test chamber and the inner screen was modified by placing two additional layers of copper screen.
5. There was trouble in leveling the glass beads to match the bottom surface of the plexiglass top. Thus it was impossible to avoid flow of fluid (air or water) between the glass beads and the plexiplate top. A possible solution would be to use a flexible top layer which would adjust to the uneven surface of the glass beads by the pressure differential, i.e. atmospheric pressure above and sub-atmospheric pressure in the glass bead pack.
6. The permeability of the glassbeads was higher than expected so the vacuum pump did not have sufficient capacity for the depth of glassbeads in the test chamber. A smaller scale test chamber was designed to meet the specifications of the vacuum pump and to avoid difficulties on working inside the original test chamber. The dimensions are the same as the original test chamber (40 in. x 40 in.) except the height of the new test chamber is 3 in. (instead of 40 in).
7. An experiment was conducted on the new test chamber. The pressure gauge near the inner screen read approximately 2 in. of Hg. The other gauges displayed no readings. The top plate of the model was then removed and air paths were noticed on the surface of the glass beads. The gauges on the top plate displayed no readings because the air flowed between the plate and the glass beads instead of through the glass beads. A solution to this problem was to place a gasket on the outer edges of the new test chamber and then reseal the top plate. This was still not satisfactory, therefore a flexible top seal replaced the rigid top plate.
8. A bigger capacity vacuum pump was installed. The vacuum pump was not working properly. The circuit breaker went off every time the vacuum pump was working for more than a minute. It was determined that the new pump required about 2 Hp. In addition, the electric circuit and circuit breaker were not adequate for a 2 Hp motor. It was proposed to use a belt or chain drive to reduce the pump speed so its power requirement is only 1 Hp.
9. On account of the low capacity of the available pump, vacuum in the porous medium are too low to be measured accurately. Therefore the accuracy of experimental results may be questionable.
10. It was difficult to measure accurately vacuums on the order of a few inches of mercury. Liquid manometers would be preferable to Boardon tube vacuum gauges and hence they will be made and will replace the vacuum gages in continuing studies.
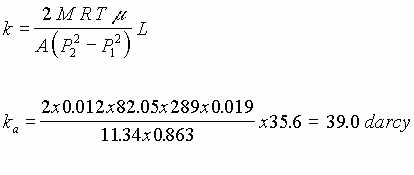
The design of a test column was necessary to determine the permeability of the porous medium (glass beads). The basic design of the test column consists of a plexiglass tube packed with glass beads simulating the porous medium. Pressure gauges are placed at both ends of the column to determine pressure drop. The porous medium is contained between two screens 14" apart. Each screen is made of a steel screen, a fine copper and rabbit wire screen attached together to avoid glass beads leakage. Washers are also placed at the screens inside the column to prevent leaks from the outer diameter of the screens. Anchors are placed to prevent any movement of the screens at the time of testing. A vacuum pump is connected to one of the ends to produce flow of either air or water, through the glassbeads in the test column.
Experiments with air and water were performed to determine the permeability of the glass beads. Air permeability, ka was measured at 39.0 darcy and water permeability, kw was measured at 20.0 darcy. These calculated permeabilities were much greater than anticipated and have contributed to some of the problems noted above

The following figures illustrate a comparison between experimental results and theoretical equations which were derived. It is noted that at small radii there is an excellent agreement between theory and practice. But at larger radii where the difference between atmospheric pressure and pressure in the porous media is small and measurements are probably inaccurate due to this small difference the deviation between theory and practice are large.
The limited capacity of the vacuum pump prevented tests at more than one flow rate, i.e. at maximum pump capacity. A series of tests at different, higher flow rates would provide better validation of the theoretical concept.
AIR IN POROUS MEDIUM, PRESSURE DRIVEN
| Point | Measured Vacuum in of Hg(P) | Distance(cm) | Theoretical Pressure P(atm) | Experimental Absolute Pressure P(atm) | Experimental Absolute Pressure P(in of Hg) |
|---|---|---|---|---|---|
| 0 | 2.5 | 7.62 | 0.916 | 0.916 | 27.420 |
| 1 | 1.8 | 10.16 | 0.943 | 0.940 | 28.120 |
| 2 | 0.0 | 15.24 | 0.980 | 1.000 | 29.920 |
| 3 | 0.0 | 25.40 | 1.025 | 1.000 | 29.920 |
| 4 | 0.0 | 45.72 | 1.074 | 1.000 | 29.920 |

WATER IN POROUS MEDIUM, PRESSURE DRIVEN
| Point | Measured Vacuum (P in Hg) | Distance (cm) | Theoretical P(atm) | Experimental Absolute Pressure P (atm) | Experimental Absolute Pressure P (in Hg) |
|---|---|---|---|---|---|
| 0 | 6.0 | 7.62 | 0.7995 | 0.799 | 23.920 |
| 1 | 4.0 | 10.16 | 0.8569 | 0.866 | 25.920 |
| 2 | 2.0 | 15.24 | 0.9379 | 0.933 | 27.920 |
| 3 | 1.0 | 25.40 | 1.0400 | 0.967 | 28.920 |
| 4 | 0.0 | 45.72 | 1.1574 | 1.000 | 29.920 |

Preliminary results indicate that the basic concept of laboratory testing of Horizontal Radial Flow in a porous medium is sound. Experimental problems appear to involve leakage and by-pass of fluid around the porous medium, and better matching of vacuum pump capacity to the porous medium permeability and cross-sectional area of flow.
The experimental and theoretical results show similar trends and there is good agreement between theoretical and experimental results in the region near the extraction point, but at radii more than about 15 cm. there is a departure between theoretical and experimental results. This may be attributed to inability to measure accurately small pressure differences.
Some difference between experimental results and theoretical calculation are normal and to be expected. But the general agreement validates the theoretical concept presented here. Hence the theoretical equations could be used as a guidance in field scale design such as determining pump capacity, well space, and required number of wells.
1. Applied Bioremediation of Petroleum Hydrocarbons, Hinchee, Robert E., Kittel, Jeffrey A., and Reisinger, H. James. Battle Press. 1995
2. "Bioslurping LNAPL Contamination," Baker, Ralph S., Brerschenk, John. Pollution Engineering, March 1996 pg. 38-40.
"Bioslurping," Naval Facilities Engineering Service Center Environmental Restoration Division Restoration Development Branch. September 20, 1996. Internet Document.
"Managing Underground Storage Tanks," Gurr, T. M., Homann, Roger L. Pollution Engineering, July 1996 pg. 40-44.
"Emerging Technologies," Hodson, Cathryn o., Williams, Drew. Pollution Engineering, July 1996 pg. 41-47.
"Geochemical Reactions During Biodegradation/Vapor Extraction Remedication of Petroleum Contamination in the Vadose Zone," Capuano, Regina M. and Johnson, Mark A. Ground Water, Jan-Feb 1996 pg 31-38.
"The Benefits of Bioventing," Schweizer, John W. Pollution Engineering, August 1996, pg 44-45.
"Simulation of Bioventing for and Groundwater Remediation," McClure, Paul D., and Sleep, Brent E. Journal of Environmental Engineering, November 1996, pg 1003-1012.